Operations
The Retool Platform, when run in a self-hosted environment (e.g., AWS, Azure, Google) will rely on compute, storage, networking, and security infrastructure. Operation focused individuals/teams will be interested in understanding how the Retool Platform can be kept in a healthy state and notified when it is not. The following best practices provide recommendations.
Best Practices
Patching and upgrades
Resource: https://docs.retool.com/self-hosted/concepts/update-deployment
Retool Enterprise Cloud patches and upgrades the solution for customers. Retool Self-hosted requires that customers perform patching and upgrades and the process is described in the resource link. Retool recommends that customers update their installation once per quarter to incorporate security and performance updates, as well as new features. These will help improve the developer and administrator experiences, and speed time to deliver.
Manage versions and releases
Resource: https://docs.retool.com/apps/management/guides/releases-and-history
As development teams create Retool applications, updates will naturally occur that require versions of the application to be created and released. While making changes to an existing application, updates are applied to the current version. Release and History capabilities within Retool permit the creation of draft releases (private releases that are not live) allowing the user to publish a live version at a later time. History provides an auditing of changes that have occurred within a release. Additional features to deleted releases, rollback of releases, and preview of specific releases are part of this capability as well.
Regardless of the number of applications and application users, release management should be a core administrative task. This allows compatible or incompatible changes to be developed and contained with a specific release increasing or improving the functionality of a Retool application.
Use source control for change management and going to production with confidence
Resource: https://docs.retool.com/source-control/quickstarts/
Resource: https://docs.retool.com/source-control/concepts/
Resource: https://docs.retool.com/source-control/guides/
Resource: https://docs.retool.com/workflows/concepts/source-control
An alternate way to manage versions and releases is to leverage protected apps, resources, modules, and workflows an enterprise cloud and self-hosted feature within Retool. This feature leverages popular Git repositories (e.g., GitHub) to prevent changes from being promoted to Retool until Pull Requests are reviewed, approved, and merged into the main branch. Once this occurs, the application and resource changes are promoted to Retool enterprise cloud or self-hosted instances. New changes to the Retool application use a new development branch keeping those modifications separate from the main branch. This capability leverages a common process used in the Software Development Lifecycle (SDLC), code review, to prevent accidental overwrites to deployed applications and to gather important feedback from the team.
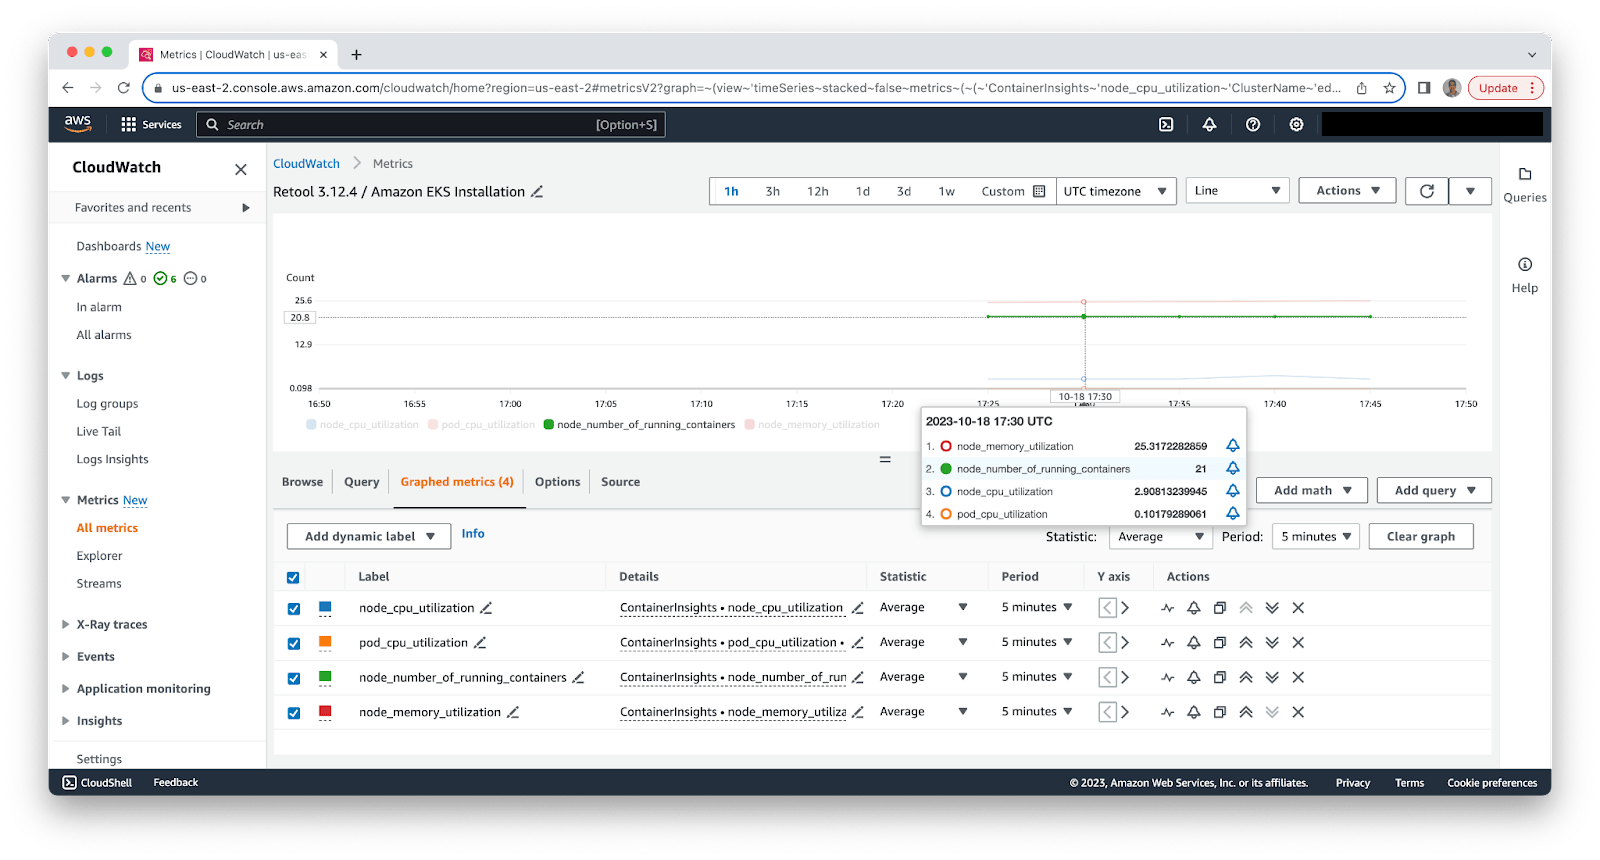
Implement Retool Platform observability tooling (Self-hosted)
Self-hosted Retool requires instrumentation and continuous monitoring to ensure healthy operation of the Retool Platform. Cloud providers provide monitoring solutions and agents (e.g., AWS CloudWatch, Azure Monitor, Google Cloud Monitoring) along with ISV partners (e.g., Datadog, Splunk etc.) to help in the collection of:
- metrics - CPU, RAM, I/O, network on Virtual Machines/Nodes and Pods
- logging - aggregation, indexing, search and anomaly detection
- tracing - ability to trace individual requests from source to destination
OpenTelemetry agent provides an open-source solution alternative supported by AWS, Microsoft Azure and Google Kuberenetes Engine to help with collection of data and downstream actions on Kubernetes. The following figure shows the metrics portion of AWS Distro for OpenTelemetry metrics in AWS CloudWatch.
Leverage Retool logs analytics to examine usage, access
Audit logs
Audit logs in Retool enable administrators to monitor user activity in the app. For self-hosted customers, these logs are found in the audit_trail_events table of the Retool PostgresDB. For cloud customers, these logs are found at /audit. Retool’s audit logs capture events like query executions, page views, user logins, changes to resources, etc.
Example metrics:
- Failed user login attempts
- How often resources are called
- HTTP response codes of API requests
- Average query durations
- Outlier query durations
- Frequency of errors
You can also send audit log events from Retool to DataDog. See our guide for more details.
Usage analytics
Retool has a built in Usage Analytics dashboard for admins to understand usage patterns. This dashboard provides an overview of application usage across all your Retool instances. This includes metrics like active users, number of app loads, and most used applications.
Example metrics:
- User sign-ins
- Most frequently viewed pages
- Most frequently logged in user
Event tracking
Retool has built-in integrations with Segment and Google Analytics to track event data within your applications.
Example metrics:
- Button clicks
- Query errors
- Form submissions
- Input field modifications
Improve application interpretability using README
Resource: https://docs.retool.com/apps/management/guides/user-documentation
Retool applications focus on supporting business use-cases. These use-cases and how the Retool application supports it should be documented for other developers participating in the development process and the users consuming it. README files are commonplace within Git managed repositories and provide a similar role within Retool. Operations should confirm that each Retool application has an associated README.
Hub and spoke management
Resource: https://docs.retool.com/org-users/guides/scale-organization
For organizations employing Retool, a common practice is to consider hub and spoke management. In this model, the focus is on two different roles, administrators and developers, and what each role is responsible for. Administrators (the hub) define core functionality for the organization including:
- Initial setup: Infrastructure
- Initial setup: Access controls
- Initial setup: Folder structure
- Initial setup: Resource integrations
- Theming and branding
- Internal wiki and best practices
- Upgrades
Developers (the spoke) focus on:
- App development
- Folder-level permissions
- Team-specific usable code
By establishing the users and permissions that support each role, a scalable solution is employed such that developers across many different spokes have the same visibility and access to themes and branding, making their job easier.
Leverage Retool Spaces for team management and scale
Resource: https://docs.retool.com/org-users/tutorials/spaces
Resource: https://docs.retool.com/retool-api/guides/automate-spaces
Enterprises that adopt the Retool Platform will require a mechanism to easily manage numerous independent teams with a single Enterprise cloud account or self-hosted instance. Retool Spaces provides multi-team support on a single instance including:
- Its own: Apps, Folders, Resources, User Groups, Workflows, etc.
- A single Source Control repo.
- A single custom SSO config.
This is administered via a Spaces administrator that can provision teams their own space to operate independently of other teams.
Automate provisioning using Retool APIs and events
Resource: https://docs.retool.com/retool-api/guides/automate-onboarding
Resource: https://docs.retool.com/retool-api/guides/automate-spaces
Resource: https://docs.retool.com/api
The use of Retool APIs, events and workflows can be used to support automated Retool provisioning (e.g. users, spaces)
Multiple instances versus environments
Resource: https://docs.retool.com/data-sources/guides/environments
Resource: https://docs.retool.com/self-hosted/concepts/multi-instance-deployment
In order to protect applications running in production, the concept of environments is commonly leveraged. Environments in SDLC, is independent infrastructure that developers, QA, and customers can utilize to support their specific needs. Examples of this would be a development (DEV), test (TEST), and user acceptance testing (UAT) environments. Retool provides two different mechanisms to support this. The first is in Retool Cloud, the environment feature allows a user to create unique environments above and beyond the default staging and production environments. Resources and configuration settings can also be aligned with the appropriate environment and managed by users with appropriate privileges.
Another approach, only supported for Retool self-hosted customers, is using multiple instances. Multiple instances means that Retool is installed multiple times on independent infrastructure to create Development, Staging, and Production instances for example. This style of configuration is prevalent in enterprises that have compliance and security requirements around separation of environments running on independently managed infrastructure. In this scenario there are additional administrative tasks such as manually synchronizing orgs, groups, themes, and other instance specific data and this should be taken into consideration.
Leverage managed services
The Retool platform integrates with a wide range of data sources and APIs. How reliable, scalable, secure, and performant these solutions are will directly impact the Retool application experience. Using managed services, operational activities are more easily performed including backups, failover, scaling, and monitoring to name a few. Examples of these managed services include Amazon Aurora PostgreSQL, Microsoft Azure PostgreSQL, and Google Cloud SQL. Determining the current status of these services starts with examining their current health status available here:
AWS: https://health.aws.amazon.com/health/status
Microsoft: https://azure.status.microsoft/en-us/status
Google: https://status.cloud.google.com/
More detailed diagnostics are available through the respective vendor using their monitoring solutions.