Query performance
Learn about query performance at different stages.
You can also use the Query Timeline in the debug toolbar to visualize and identify long query run times, duplicate queries, and chained queries.
Complex queries or those retrieving large amounts of data can affect the performance of apps and workflows. Retool provides details about the performance of queries and breaks down these measurements between the backend and frontend.
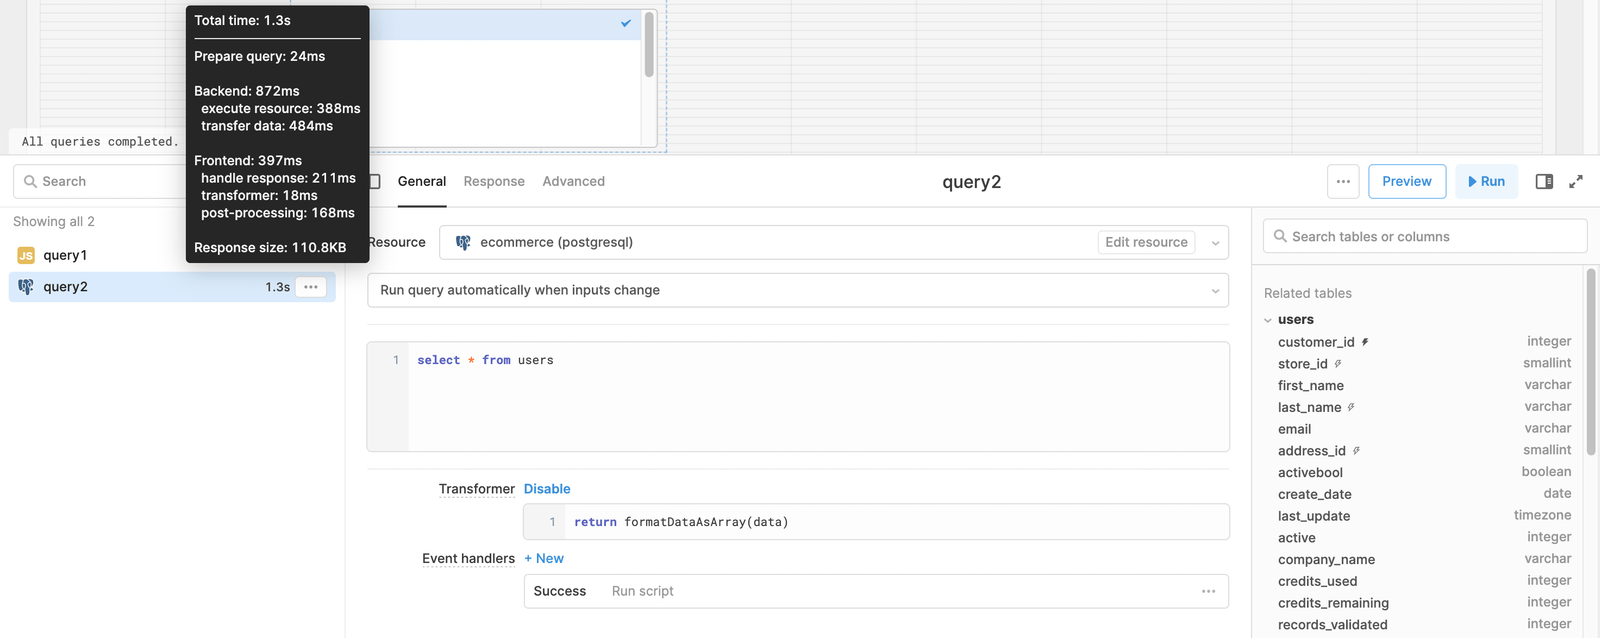
Queries display the total runtime in the query editor once they complete. Place the cursor over the runtime to display a popover menu with a breakdown of performance.
The lifecycle of a query is shown in the diagram below.
- Transfer data: The latency between the client browser and the Retool DBConnector service.
- Execute resource: The latency between the Retool DBConnector service and the end-user resource.
Total time
The total time for the query to execute and receive a complete set of results.
Prepare query
The time taken to calculate all inputs to a query in the Retool frontend, format the request, and then send it to the Retool backend to make a request to the resource.
Backend
The time taken by the Retool backend to execute the query with the resource, and transfer data to and from the Retool backend. It includes the following measurements.
| Measurement | Description |
|---|---|
| Execute resource | The time taken by the Retool backend to prepare the query, execute it with the resource, and receive the response. Network latency between Retool and the resource, along with the time taken by the resource to perform the request, can impact the time taken. Larger queries and responses require more bandwidth and can be more affected by network quality. |
| Transfer data | The time taken to transfer the query and results between the Retool backend and frontend. |
Frontend
The time taken by the Retool frontend processing the query results. It includes the following measurements.
| Measurement | Description |
|---|---|
| Handle response | The time taken to receive the query response in the Retool frontend and populate the query's data property in the app's data model |
| Transformer | The time taken processing the query's original data property using your attached transformer and returning a result. This statistic only appears if the query has a query transformer attached and enabled. More complex transformers with many recursive iterations or additional data references take longer to process. |
| Post-processing | The time taken to update all dependencies inside of the Retool app that reference properties of this query. For example, a Table component that displays {{query2.data}} or a Text Input component that displays {{ query2.data[0]name }}. The more dependencies to update, the longer this can take. |
Response size
The total size of the payload received. Larger payloads result in longer processing times in both the Retool backend and frontend.