Debug Tools
Investigate and resolve issues with Retool's built-in debugging tools.
Debug Tools are available within the app IDE, Resource configuration page, and Query Library. They enable you to troubleshoot and fix issues with Retool apps, resources, and queries.
App IDE
The status bar at the bottom of the app IDE displays the current environment, release, query runtime information, and the number of errors. You can click the environment to open a list of other environments to switch to. Clicking the error text in the lower right corner or pressing ctrl + ` opens the Debug Tools.
Searching
You can search in the Console and State tab using any free text, negation, regex, or exact phrases:
- Free text: Matches any string.
- Negation: Prefix with
-to exclude a match. For example:-error - Regex: Use slashes for regex. For example:
/^foo/ - Exact phrases: Wrap multi-word strings in quotes. For example:
"query failed"
Combine search terms using spaces (e.g. "query failed" -/error/ success).
Console tab
The Console tab is shown by default when you open the debug window. It displays a list of errors, warnings, and success messages that relate to your queries, transformers, event handlers, etc. You can also run JavaScript in the command line to help debug issues. For example, entering something like text1.value returns the text1 component's value.
Timeline tab
The Timeline tab shows a live view of all query runs. It makes it easier to visualize run times, compare sequencing, and identify failed, successful, and active queries. This feature is useful when debugging apps that run multiple queries in parallel or that chain queries together.
State tab
The State tab provides a list of queries, components, and global variables used in your app. Clicking an item in the sidebar displays more details. For example, if you select a component, you can see the current value and other property information. At the bottom of the window, it also shows the queries that component depends on. If you select a query, the components updated by that query are displayed instead.
Linting tab
The Linting tab displays JavaScript errors, such as undefined variables and invalid syntax. Click an error to open the code in the app to investigate and debug.
Performance tab
The Performance tab surfaces suggested app optimizations directly related to performance. It’s a useful tool to diagnose common problems that degrade performance and view relevant app stats per page.
For more information about optimizing your app based on the recommendations in the Performance tab, refer to the Best Practices guide.
Export JSON with hard-coded query results
If you are encountering issues with your app, providing the Retool support team with a copy of your app JSON with hard-coded query results can make it easier for them to help identify problematic query behavior. Standard app exports do not include any data from your data sources.
If you are comfortable providing this information to Retool, at the top of the Debug Tools window, click to download a copy of the app JSON with hard-coded query results.
The download includes JavaScript return statements that represent the outputs of your queries.
Resource configuration page
Some resources have testing options for verifying connection settings. Supported resources include a Test connection option when you create or edit the resource.
Similarly, there are options for testing authentication settings when using Custom Auth. Not every custom auth configuration has these options, but the full list includes:
- Test auth workflow
- Test refresh auth workflow
- Check authentication status using current credentials
When you test auth workflows or connections, Retool displays a notification indicating whether the test passed or failed. Click View in console to open the Debug Tools console. The console includes detailed information, including errors, tokens, headers, URLs, etc.
If you're debugging a connection issue, see the Troubleshoot connections page for more details.
Query Library
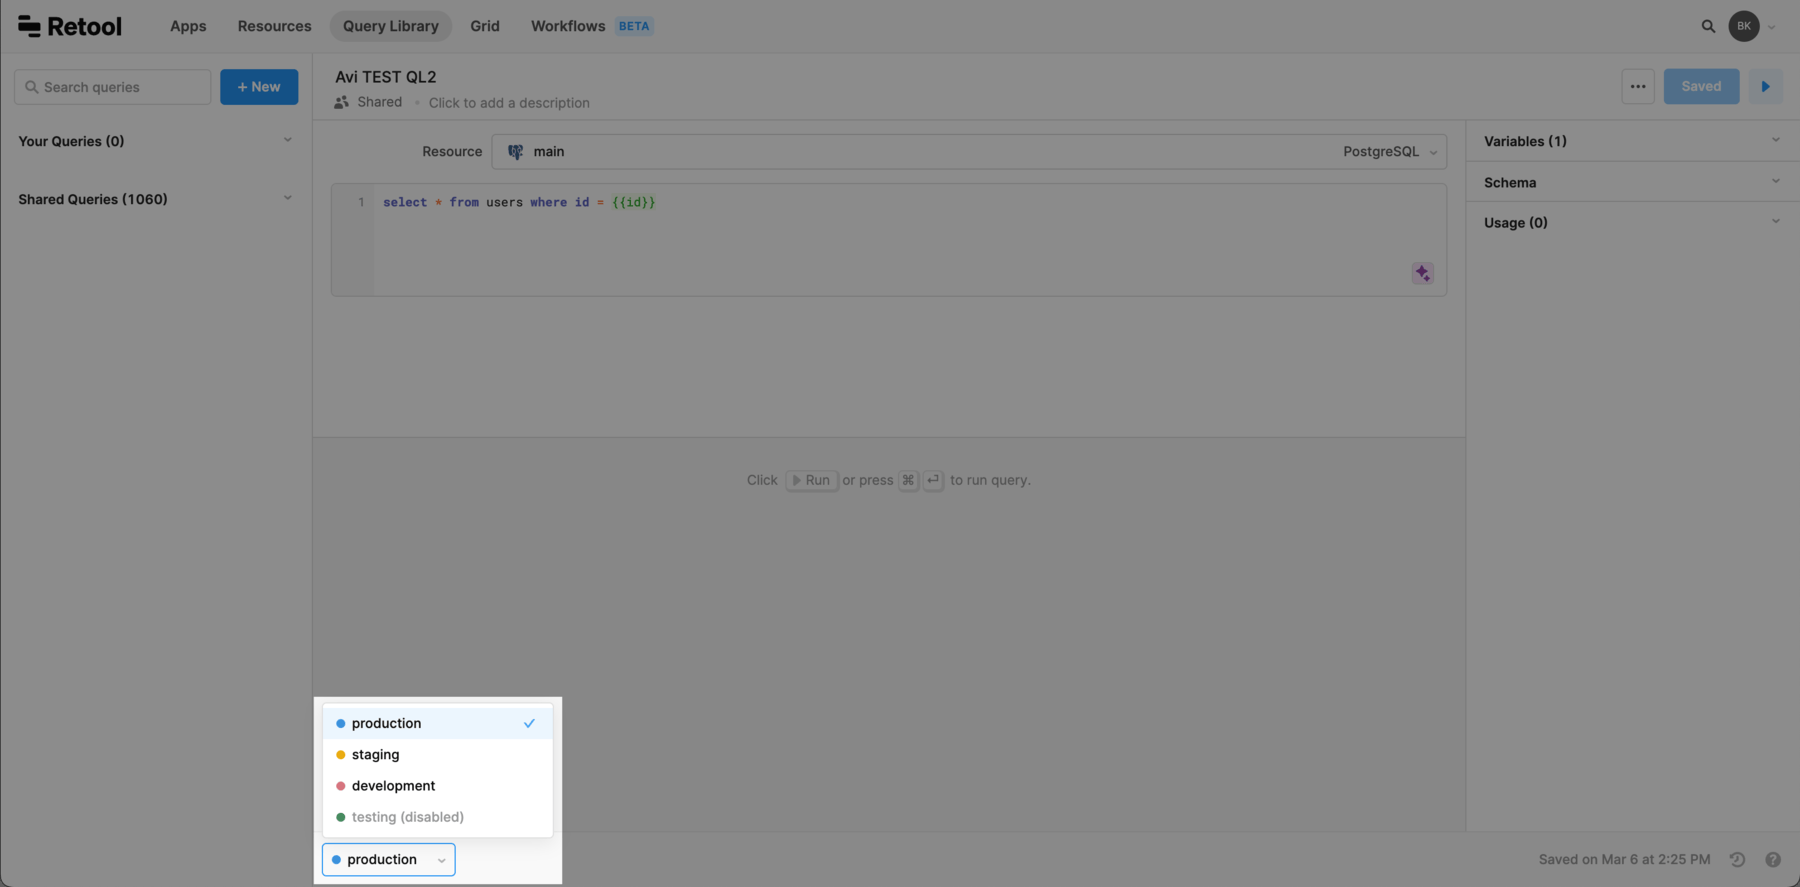
Debug Tools for the Query Library allows you to switch between environments, which means you can test queries before using them in production. In the status bar at the bottom of the page, click on the current environment to switch to a different environment.
You can also view a query's history by clicking the Saved on text in the lower right corner. This opens a modal that shows the history, and allows you to revert to a previous version.