Google Analytics query tutorial
Learn how to interact with your Google Analytics integration.
You can connect to Google Analytics by creating a resource in Retool. Once complete, you can write app or workflow queries to interact with Google Analytics APIs.
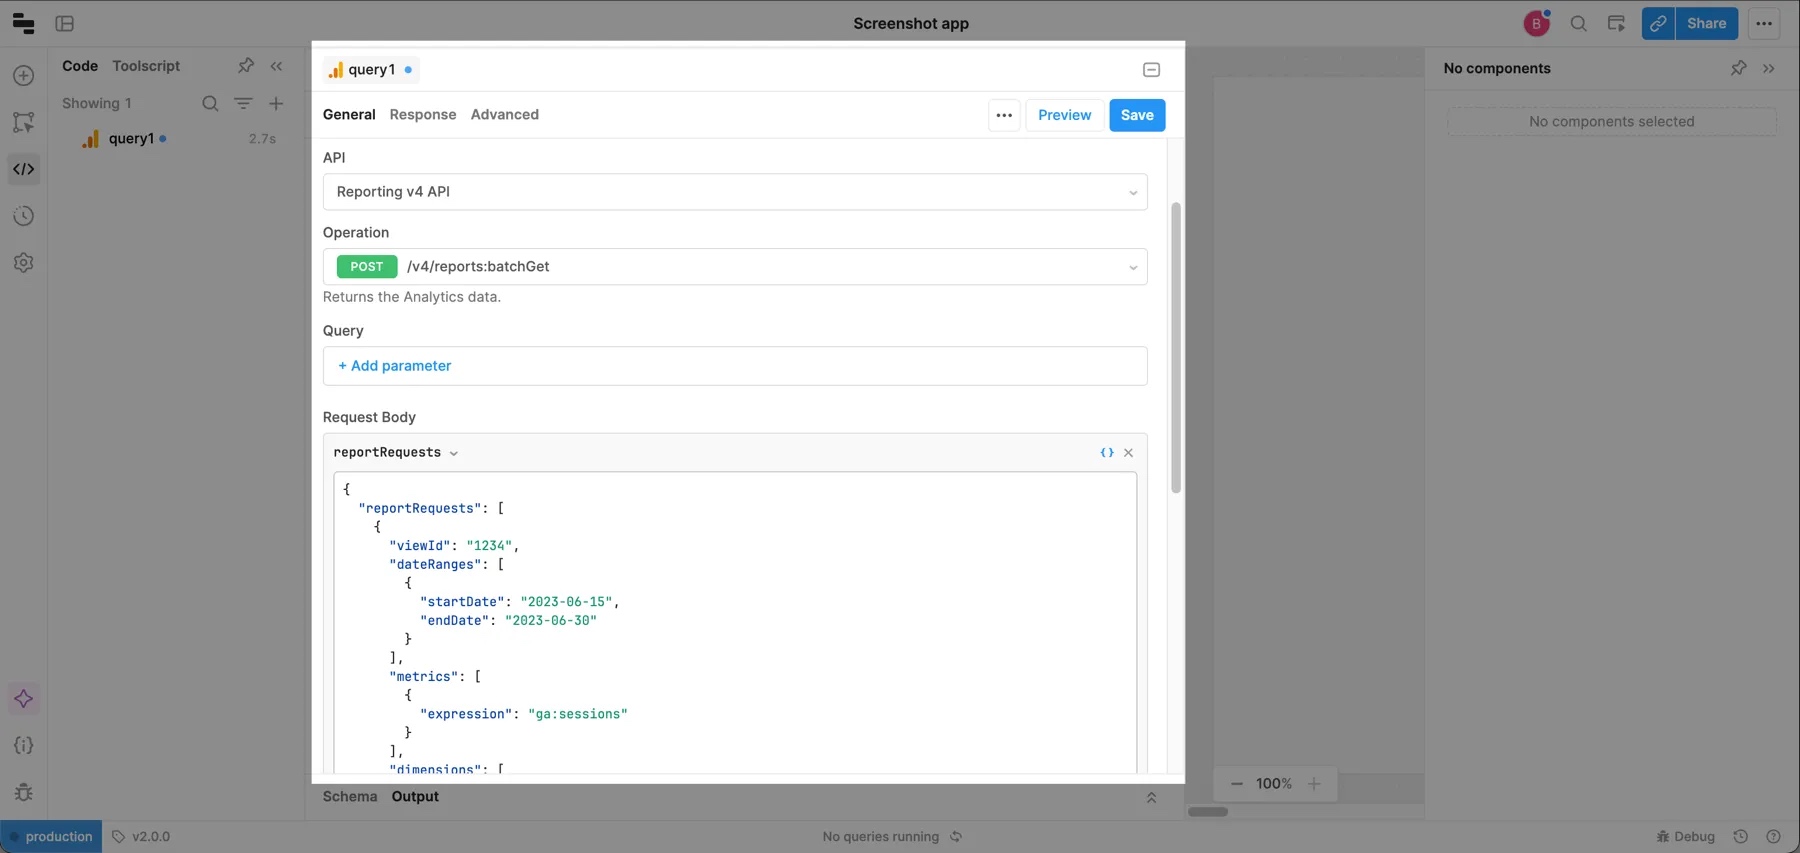
To start, select the API you want to query from the API dropdown. Next, select the desired API operation from the Operation dropdown. You can also search for available operations within this field.
After you select an operation, the query editor displays additional Path and Query parameters.
If you connect to Google Analytics using OAuth 2.0, you need to grant access to Retool in the Google Admin console under Security > Apps.
Build an analytics report
To build a report using the /reports:batchGet operation of the v4 Reporting API, review the Google Analytics API documentation. Google also provides an interactive Request Composer for building requests you can copy and paste into Retool.
Process the report response
The /v4/reports:batchGet endpoint returns an array of Report objects. While the Report object contains useful metadata, you may need to manipulate the data to render its results in a chart or table. You can use the following transformer on your query to parse results into a useable table.
const transformedReports = data.reports.map((report) => {
  const { columnHeader } = report;
  const dimensionEntries = (columnHeader.dimensions || []).map((name) => name);
  const metricHeaderEntries = (
    columnHeader.metricHeader.metricHeaderEntries || []
  ).map((o) => ({ ...o, key: o.name }));
  const rows = report.data.rows || [];

  const formattedData = rows.reduce((arr, row) => {
    const dimensions = row.dimensions || [];
    const flatDims = dimensions.reduce((obj, value, index) => {
      const key = dimensionEntries[index];
      return { ...obj, [key]: value };
    }, {});
    const flatMetrics = row.metrics[0].values.reduce((obj, value, index) => {
      const { key } = metricHeaderEntries[index];
      return { ...obj, [key]: Number(value) };
    }, {});
    arr.push({ ...flatDims, ...flatMetrics });
    return arr;
  }, []);
  return { ...report, formattedData };
});

return { ...data, reports: transformedReports };
The following snippets show the response after the transformer has been applied.
- {{gaQuery.data.reports\[0].formattedData}}
- {{gaQuery.data.reports\[0].data}}
    [ {
        "ga:landingPagePath": "/",
        "ga:users": 147825,
        "ga:goal1ConversionRate": 5.254646535406078,
        "ga:goal1Completions": 14102
      },
      {
        "ga:landingPagePath": "/contact",
        "ga:users": 32371,
        "ga:goal1ConversionRate": 0.0040,
        "ga:goal1Completions": 130
      }, {...},
]
  { "columnHeader": {
        "dimensions": ["ga:landingPagePath" ],
        "metricHeader": {
          "metricHeaderEntries": [
            { "name": "ga:users", "type": "INTEGER" },
            {  "name": "ga:goal1ConversionRate","type": "PERCENT" },
            { "name": "ga:goal1Completions",  "type": "INTEGER" }
          ]
        }
      },
      "data": {
        "rows": [
          { "dimensions": [ "/" ],
            "metrics": [
              {  "values": [ "148876", "5.270975823347485", "14265" ]  }
            ]  },
          {
            "dimensions": [ "/blog/salesforce-for-engineers/" ],
            "metrics": [
              { "values": [  "31963",  "0.0",  "0"  ] }
            ]
          }, {...}],
     ...}