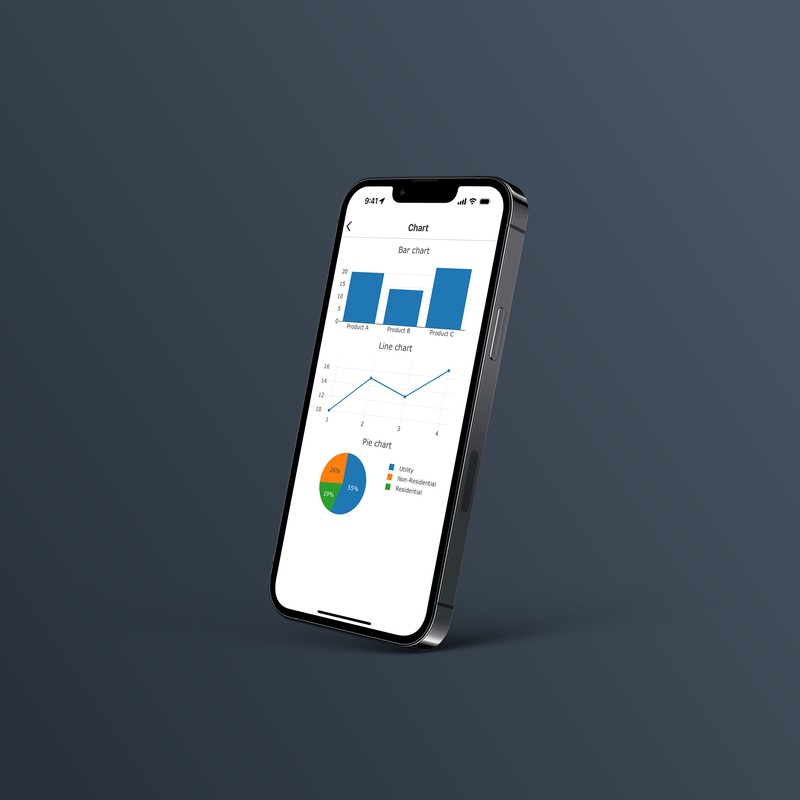
The Chart mobile component
A chart to visualize datasets.
A chart to visualize data in different layouts using Plotly. Refer to Plotly's JavaScript reference to learn more about available options.
Settings
Chart includes the following configurable options when building apps in the IDE.
| Content | Data |
| Appearance | Aspect ratioShow on desktopShow on mobileDirectionMaintain space when hiddenMarginAlways show in edit modeStyles |
Properties
All properties for Chart with supported data types or values. You can write JavaScript almost anywhere in Retool to manipulate or read property values.
aspectRatio
The ratio of width-to-height (e.g., 1.3 to use 4:3 ratio).
id
The name.
isHiddenOnDesktop
Whether the component is visible in the desktop layout.
isHiddenOnMobile
Whether the component is visible in the mobile layout.
maintainSpaceWhenHidden
Whether the component takes up space on the canvas if hidden is true.
pluginType
The plugin type.
showInEditor
Whether to remain visible in the editor if hidden is true.
Methods
JavaScript API methods for interacting with Chart. You can write JavaScript almost anywhere in Retool and use methods to manipulate data and property values.
setHidden
Set the hidden value to toggle whether the component is visible. Defaults to true without a parameter.
chart.setHidden(hidden)