App Performance Guide
Retool provides powerful development tools and an extensive library of pre-built components to support the development of any internal enterprise application. This guide presents a comprehensive framework for understanding, building, and optimizing Retool applications through three complementary lenses:
- Lens 1: Understanding Performance - How Retool apps operate and what dictates their performance
- Lens 2: Building Performant Apps - Best practices for developers creating new applications
- Lens 3: Debugging & Optimization - Strategies for improving existing applications
This guide has been co-developed with the Retool Performance and Professional Services teams, distilling their expertise into actionable guidance for developers at all levels. The content aligns with Retool's official documentation at docs.retool.com and reflects current best practices for Retool 3.x (v3.148+).
Lens 1: Understanding Retool App Performance
To build and optimize Retool applications effectively, you must first understand the underlying architecture and factors that influence performance.
1.1 The Retool Architecture
Retool applications operate within a browser environment and follow a client-server architecture with three distinct performance domains:
- App Performance - The browser's processing of HTML, CSS, and JavaScript using the JavaScript runtime. This represents the client-side rendering and interaction performance.
- Query Performance - The time required for data requests to travel from App → Retool Server → Data Services and back. This encompasses network latency and data service processing time.
- Total Performance - The combined end-user experience, representing App Performance + Query Performance.
If you want to learn more about the Retool Architecture and its services, please review this documentation.
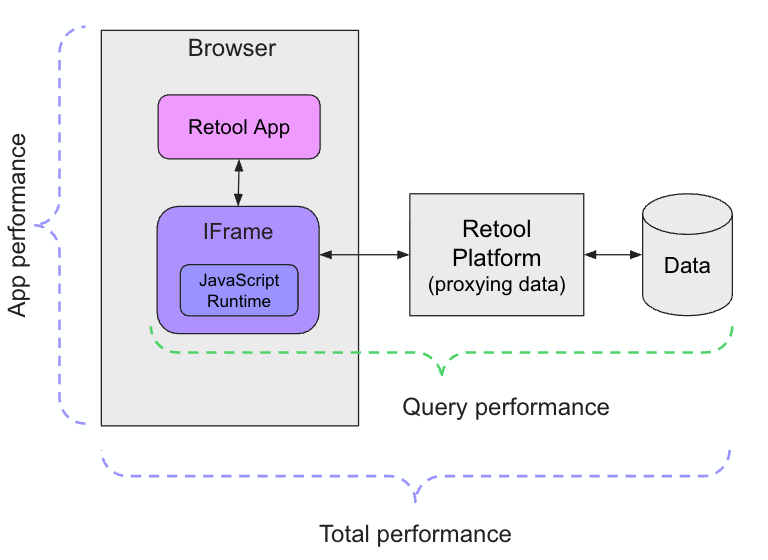
The following image provides a way to correlate the previous types of performance:
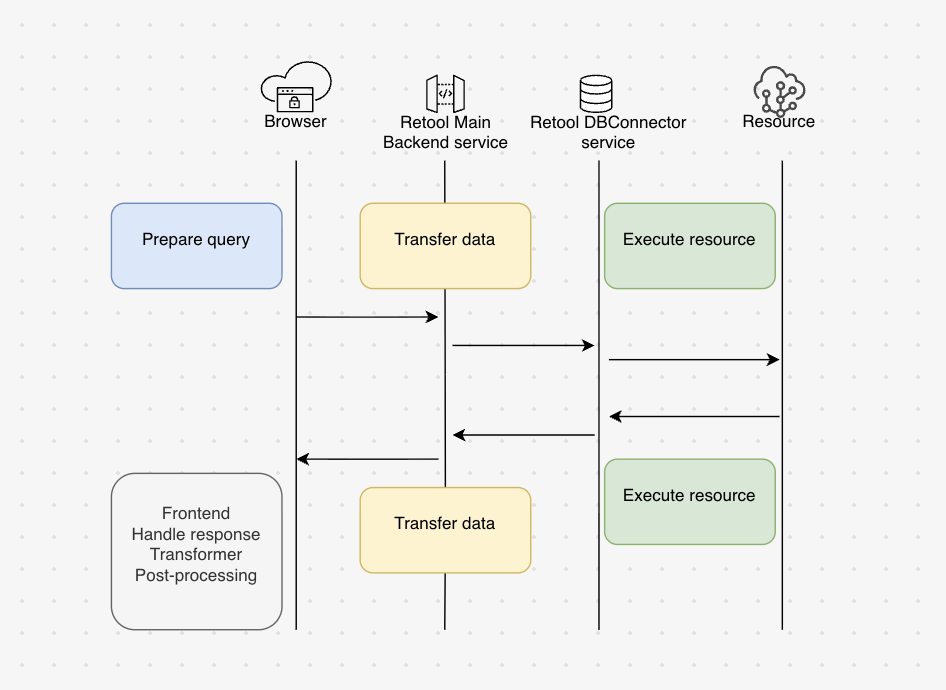
1.2 The Request Lifecycle
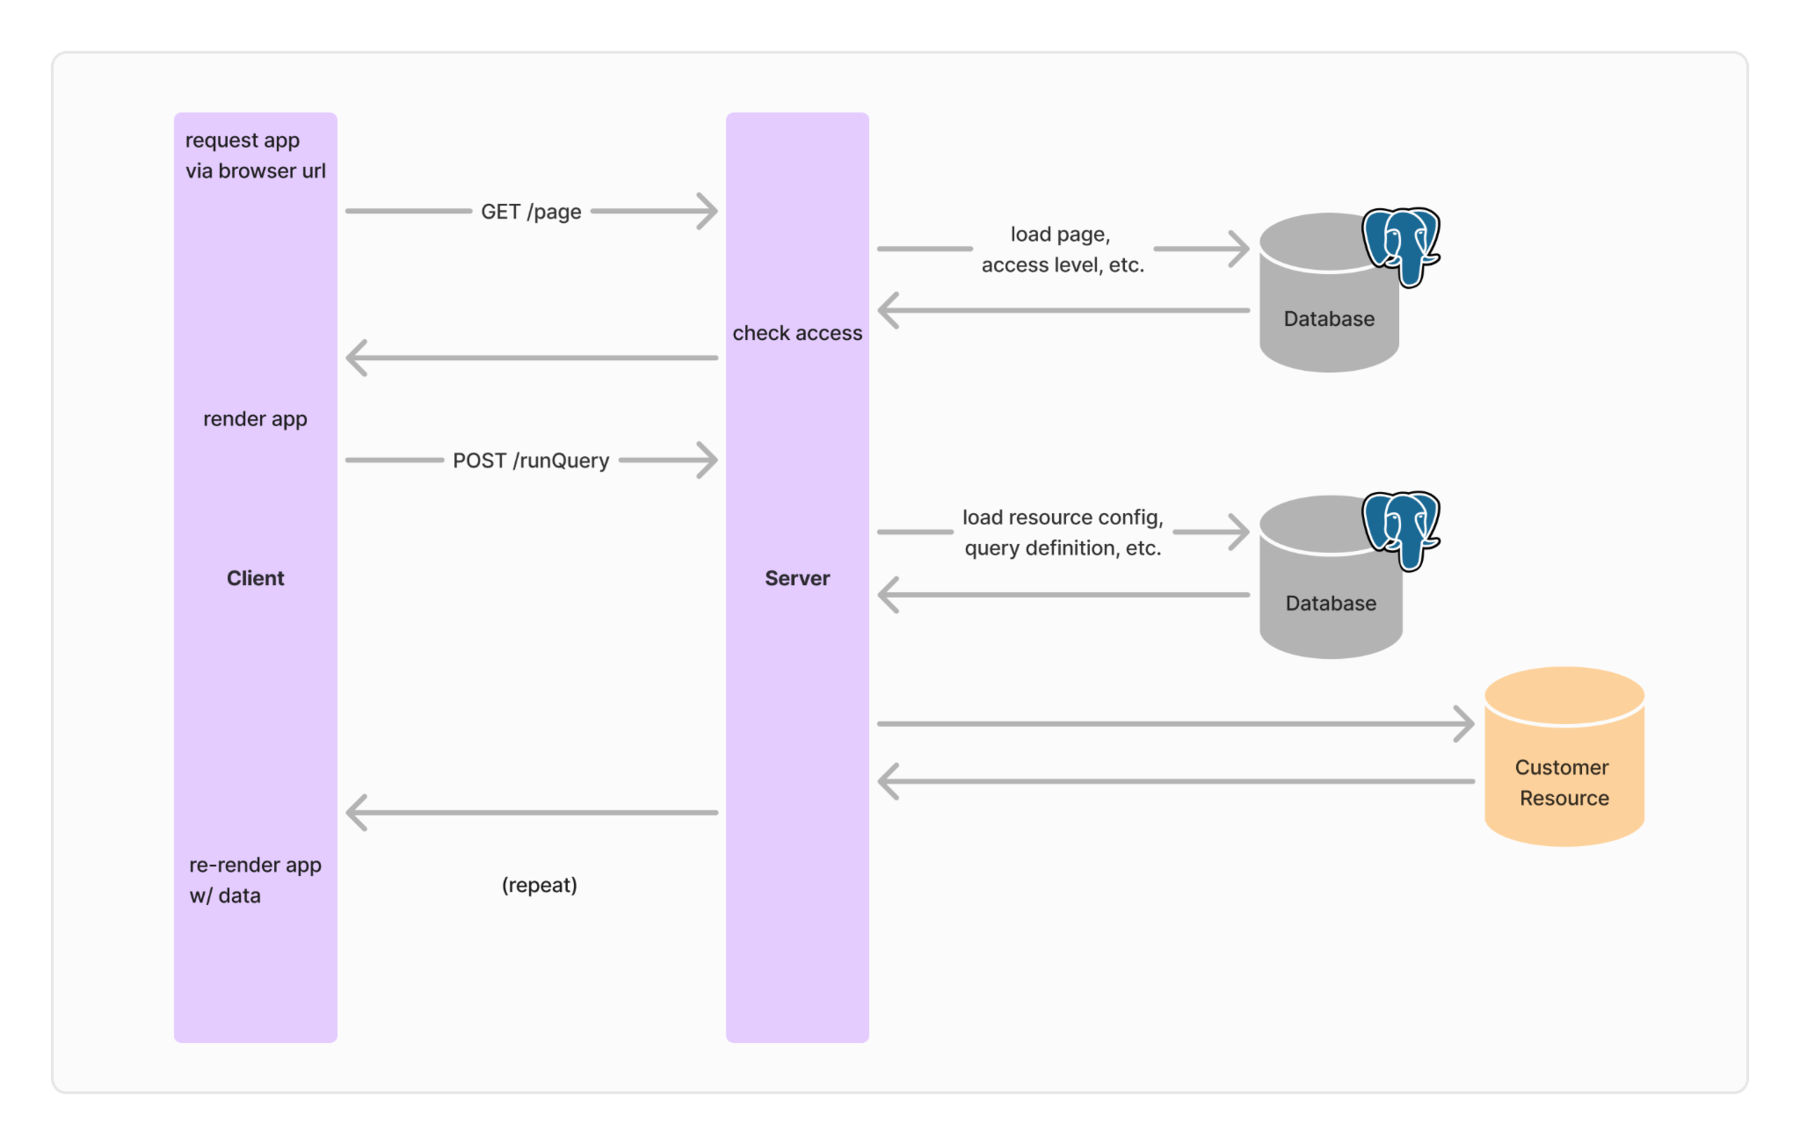
A typical Retool app interaction follows this sequence:
- Browser sends GET request to retrieve the Retool app
- App renders in the browser (HTML/CSS/JavaScript processing)
- App sends POST requests to execute queries
- Retool Server forwards requests to data services
- Data services process and return results
- App re-renders with the returned data
Each step introduces potential latency that accumulates into the total user experience. Understanding where time is spent in this lifecycle is crucial for optimization. The following image articulates the steps listed previously.
1.3 Key Performance Factors
Application Complexity
-
Component count - Each UI component incurs processing time during page load and user interaction. Applications with excessive components (1000+ on a single page) experience significant performance degradation. As of Retool 3.148+, multipage apps are the default architecture, providing faster load times by only evaluating code and components on the currently active page. Each component adds approximately 5 ms to page load time and 0.1 ms for interaction time.
-
Query complexity - The number of queries, their execution mode (serial vs. parallel), and their interdependencies directly impact load and interaction times.
-
JavaScript execution - Builder defined JS code (including transformers and custom scripts) run client side in the browser JS runtime which is single threaded. Heavy computation tasks will compete for UI rendering computation which if blocked will lead to UI jank, slowdown, or a browser crash in the worst case
Network & Infrastructure
-
Geographic proximity - Distance between Retool Server and data services introduces unavoidable network latency. Cross-region queries can add hundreds of milliseconds.
-
Network quality - Bandwidth, packet loss, and connection stability affect data transfer speeds, particularly for large payloads. Determine your underlying network using Speedtest.
-
CDN and caching - Content delivery networks and query caching can significantly reduce repeated request times.
-
Triple hop architecture - App queries must travel through the Retool backend, the Retool DB connector, and the end user data Resource. Three hops mean the network latency can be up to 3 times longer than a direct download from the Resource.
Client Device Capabilities
-
CPU performance - JavaScript execution is single-threaded. Older or low-end processors struggle with complex applications. Use Speedometer to identify the CPU capability. A score of 23.8 can be achieved on a MacBook Pro (2021) running an Apple M1 Pro chip, which results in strong performance for both app building and usage.
-
Available memory - Browser memory constraints can cause performance issues with large datasets or complex applications. The recommendation is to have at least 8GB of storage on the device.
-
Browser efficiency - Different browsers and versions have varying JavaScript engine performance. Power-saving modes, such as Windows' Efficiency Mode, can throttle performance.
Data Characteristics
-
Response size - Large payloads (MB+ range) require more network bandwidth and processing time. Retool recommends keeping responses in the KB range.
-
Data structure complexity - Deeply nested objects or wide tables with many columns increase parsing and rendering overhead.
-
Resource query efficiency - Unoptimized database queries or slow API endpoints directly impact query performance regardless of Retool optimization.
1.4 Performance Metrics Explained
Retool provides specific metrics to quantify performance. Understanding these metrics is essential for both development and debugging.
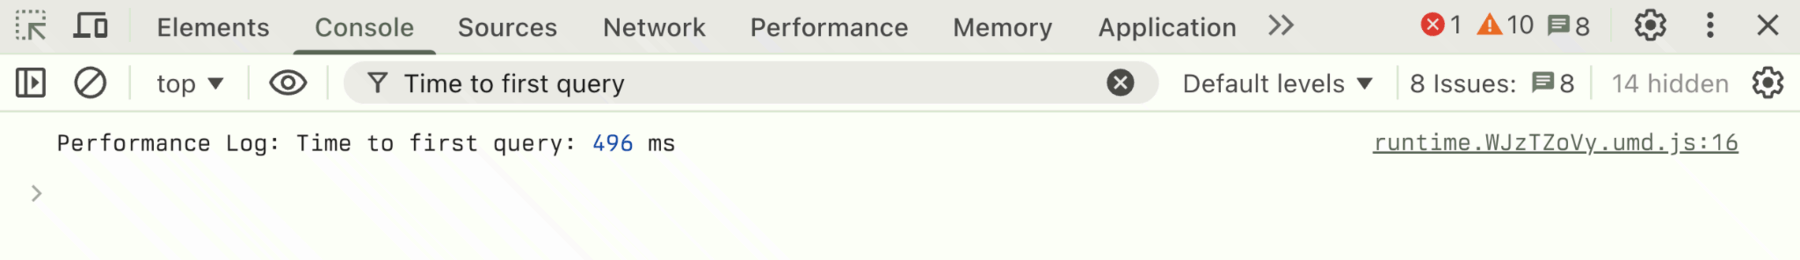
Time to First Query (TTFQ)
The time from when a user opens the app to when the first query runs. This metric can be affected by app size, number of components, and complexity of custom JavaScript.
Access via: Chrome Developer Tools > Console > 'Performance Log: Time to first query'
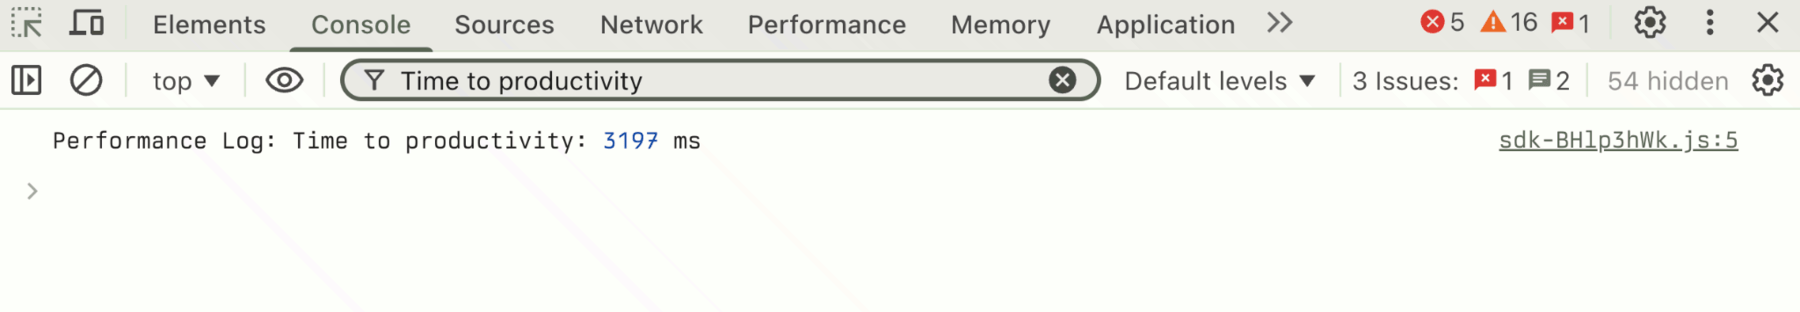
Time to Productivity (TTP)
The time from when the first query runs to when the last long task (>50ms) completes. This is a proxy for when the app is ready for user interaction.
Access via: Chrome Developer Tools > Console > 'Performance Log: Time to productivity'
Query Performance Breakdown
Query statistics provide granular timing information that can be viewed by hovering over a query in the Retool IDE.
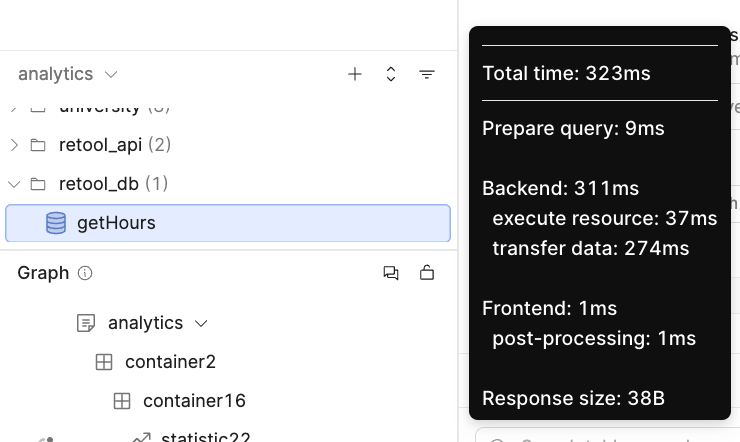
Using the following image, the table breaks down the timings and what they measure:
These metrics break down into several components:
| Type | Description |
|---|---|
| Total time | The total time for the query to execute and receive a complete set of results. |
| Prepare query | The time taken to calculate all query inputs in the Retool frontend, format the request, and send it to the Retool backend to make a request to the resource. |
| Backend | Total time it took to execute the resource and transfer data |
| Execute Resource | The time taken by the Backend (DBconnector service) to prepare the query, execute it with the resource, and receive the response. Network latency between Retool and the resource, along with the time the resource takes to process the request, can affect the overall time. Larger queries and responses require more bandwidth and can be more affected by network quality. |
| Transfer Data | The latency between the client browser and the Retool DBConnector service. |
| Frontend | The time taken by the Retool frontend processing the query results. It includes the following measurements. The time taken to receive the query response in the Retool frontend and populate the query's data property in the app's data model |
| Post-processing | Transformer or serialization time. |
| Response size | The total size of the payload received. Larger payloads result in longer processing times in both the Retool backend and frontend. |
Lens 2: Building Performant Retool Applications
Proactive performance optimization during development prevents costly refactoring later. This section provides a systematic approach to building performant applications from the start, aligned with Retool's official best practices.
2.1 Pre-Development Planning
Define Performance Requirements
Work with stakeholders to establish clear, measurable performance goals before writing any code. These non-functional requirements should specify:
- Maximum acceptable latency for key actions - Example: "Creating a purchase order should complete in under 6 seconds."
- Data display requirements - Example: "Display at least 100 rows in the inventory table for common SKU access."
- Background processing expectations - Example: "Order cancellation should be asynchronous with notification upon completion."
Establish Baseline Performance
Before development begins, measure baseline performance across all intended user environments:
- Create an empty or minimal Retool application
- Measure TTFQ and TTP on end-user devices (various laptops/desktops, locations, and network conditions)
- Perform the same measurements on developer machines for comparison
- Test device CPU performance using: https://browserbench.org/Speedometer3.1/
- Test network performance using: https://www.speedtest.net/
This baseline establishes realistic performance targets and identifies environment-specific constraints early.
Scope Application Complexity
Collaborate with design and business teams to document:
- Functional requirements and user workflows
- Figma designs and UI specifications
- Data services and their locations
- Estimated component count and query complexity
Understanding application complexity upfront enables better architectural decisions. As of Retool 3.148+, multipage apps are the default and strongly recommended architecture, providing faster load times by only loading the code and components needed for the current page.
2.2 Query Optimization Strategies
Minimize Response Sizes
Large payloads significantly impact total performance. Keep query responses in the KB range rather than MB or larger.
-
Select only necessary columns - Replace
SELECT * FROM customers;with specific column selections:SELECT id, first_name, last_name, email FROM customers; -
Implement server-side pagination - For tables displaying large datasets, use server-side pagination to limit results to 20-50 rows at a time rather than loading hundreds or thousands of records. The Table component supports both OFFSET/LIMIT and CURSOR-based pagination. This is particularly important for Table and List View components, which are virtualized by default to render only visible items.
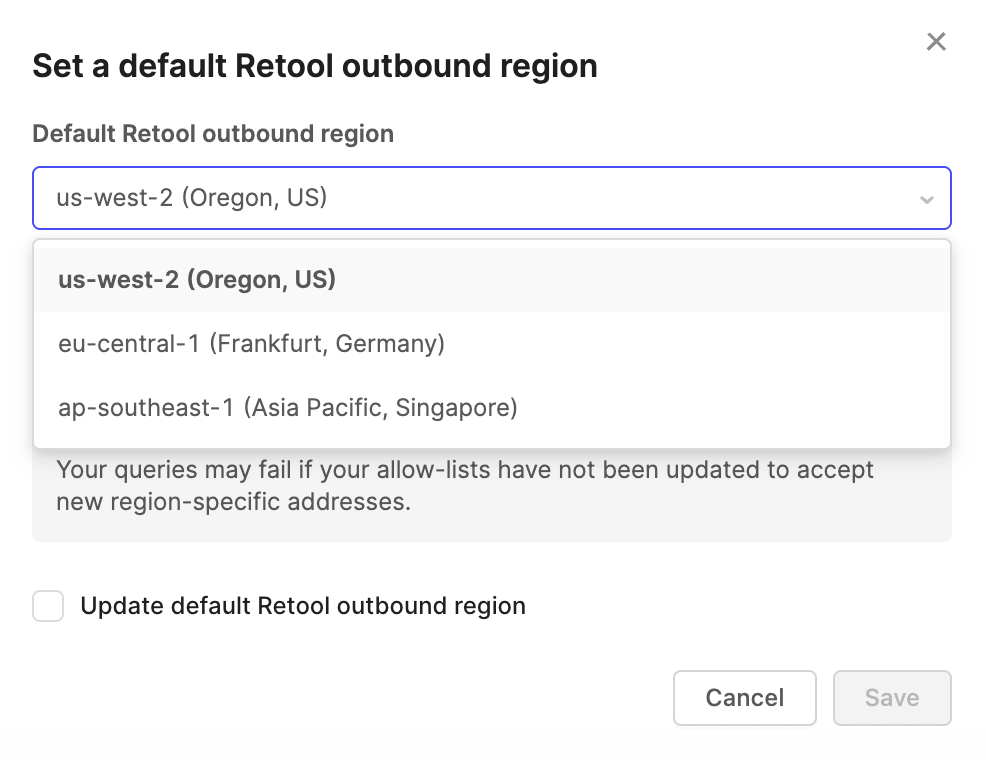
Optimize Geographic Proximity
Network latency between Retool and data services directly impacts query performance.
-
Retool Cloud - Configure the outbound region in Settings > Advanced > Set Outbound Region to match where your data services reside.
-
Self-Hosted Retool - Deploy Retool in the same AWS, Azure, or GCP region as your data services. Use private networking when possible to reduce latency and improve security.
For Retool Cloud, the following image shows enabling a different region:
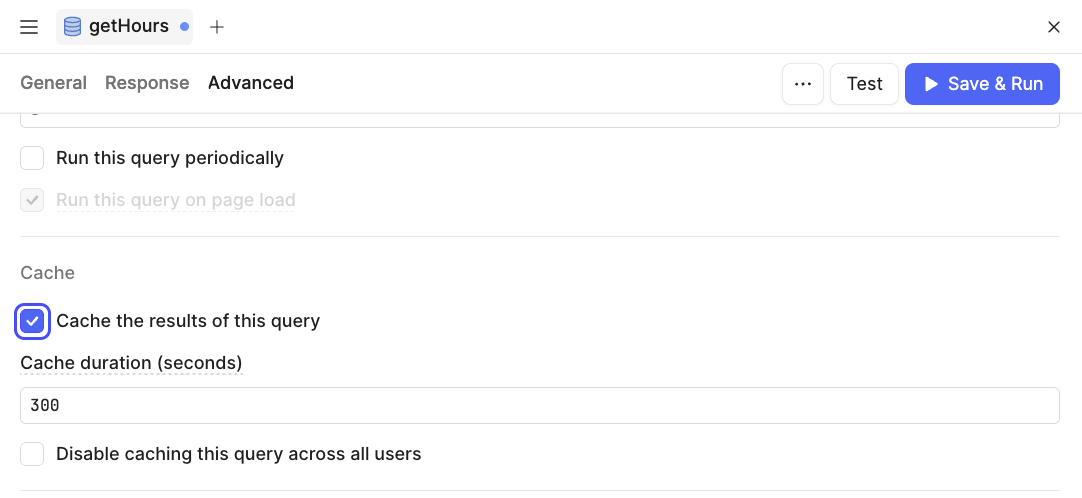
Leverage Query Caching
Enable Redis caching for frequently executed queries that return relatively static data. This is particularly beneficial when multiple users execute the same queries. For example, if you cache a query and 100 users run it within the cache duration, your resource is accessed only once instead of 100 times.
-
Retool Cloud: Caching is automatically enabled. Enable it per-query in Advanced Settings.
-
Self-Hosted - Configure Redis according to Retool's environment variable documentation before enabling caching.
The following image shows this enabled:
2.3 Application Architecture Best Practices
Manage Application Complexity
Application complexity directly correlates with performance degradation. Follow these guidelines:
-
Limit components per page - Keep component counts under 300. Applications with 1000+ components on a single page experience severe performance issues.
-
Use multipage applications (default as of v3.148+) - Distribute functionality across multiple pages rather than creating monolithic single-page applications. Multipage apps provide faster load times on average by only evaluating code and components on the currently active page. If you have legacy single-page apps, convert them to multipage apps to realize immediate performance benefits.
-
Minimize global scope usage - While global components, queries, and variables are convenient in multipage apps, they add to every page's complexity. Retool continuously evaluates globally scoped objects regardless of the current page, increasing dependency graph size. Use global scope sparingly.
-
Use modules wisely - Modules enable code reuse but contribute to app size. Module components are separately executed, so including a component in a module does not prevent it from impacting performance. Minimize hidden components in modules and avoid excessive nesting.
Optimize Query Execution
-
Parallel execution - Configure independent queries to run in parallel rather than serially. Use Debug Tools > Timeline to verify execution patterns.
-
Avoid redundant queries - Review the timeline for duplicate query executions. Consolidate redundant data fetching. If you have many similar queries (e.g., multiple queries for the same database table), consider using query JSON as SQL or JavaScript transformers to reduce the number of requests.
-
Offload processing to workflows - For complex operations or when targeting low-end devices, move JavaScript-heavy processing from the browser to Retool Workflows. Expose workflows via webhooks and invoke them from the app.
Component Selection and Configuration
-
Use modern components - Retool recommends upgrading to the most modern components. Tables and List Views are especially important because of their large impact on application performance. List View components are virtualized by default, optimizing performance by rendering only the items currently visible in view.
-
Minimize unnecessary containers - Each visual element adds load time. Remove purely decorative containers that don't serve functional purposes.
-
Simplify component trees - Avoid deeply nested component structures when flatter alternatives exist. Deep references to other components result in long dependency chains that increase processing and troubleshooting time.
2.4 Continuous Performance Monitoring
Performance should be monitored continuously throughout development, not just at the end. Use these tools regularly:
Debug Tools
-
Timeline view - Examine query execution patterns, identify serial vs. parallel execution, and spot redundant queries.
-
Performance tab - Review Retool-identified optimization opportunities for queries and component configuration. The performance tab compiles useful statistics for measuring optimization effectiveness.
-
Linting tab - Highlights which queries or components could be degrading performance.
Query Statistics
After executing a query, hover over it in the IDE to view detailed timing breakdowns. Pay particular attention to:
- Execute Resource time - Indicates data service performance and network latency
- Response size - Large responses indicate the need for pagination or column reduction
- Post-processing time - High values suggest complex transformers that may need optimization
Production Monitoring
Configure production monitoring early in the development cycle:
- Enable DataDog or Sentry integration for performance metrics forwarding
- Generate HAR files using Chrome DevTools to capture real user experiences
- Review TTFQ and TTP metrics regularly as features are added
Lens 3: Debugging and Optimizing Existing Applications
When applications exhibit performance issues, a systematic debugging approach helps identify the root causes and guides optimization efforts. This section presents real-world scenarios and proven debugging strategies.
3.1 Systematic Debugging Methodology
Step 1: Gather Information
Document current performance:
- Measure TTFQ and TTP in affected environments
- Count total components and components per page (visible in IDE)
- Document Retool version and deployment type (Cloud/Self-Hosted)
- Identify data service locations and network topology
- Note affected user populations (all users, specific locations, specific devices)
Step 2: Isolate the Problem Domain
Determine whether the issue is App Performance, Query Performance, or both:
-
App Performance issues - Slow initial loads, laggy UI interactions, high CPU usage in the browser, consistent issues across different networks. Issues persist even after disabling all queries.
-
Query Performance issues - Slow data loading, long Execute Resource times, issues vary by network/location, data service logs show slow queries
Step 3: Use Debug Tools
Open Debug Tools and examine:
-
Timeline - Are queries executing serially when they could be parallel? Are the same queries executing multiple times? Which queries take the longest?
-
Query Statistics - Where is time being spent? Is Execute Resource time high (data service issue)? Is the response size large (needs pagination)? Is post-processing slow (complex transformer)?
-
Performance Tab - What optimization recommendations has Retool automatically identified? Check query stats, app size metrics, and component counts.
-
Linting Tab - Identifies specific queries or components that could be degrading performance.
Step 4: Test in Controlled Environments
Compare performance across different contexts:
- Create an empty app and measure baseline TTFQ/TTP
- Test on developer machines vs. end-user devices
- Test from different geographic locations
- Measure device CPU performance (Speedometer 3.0) and network speed (speedtest.net)
Step 5: Form Hypotheses and Test
Based on gathered data, form specific hypotheses and test them systematically. The following scenarios illustrate this approach.
3.2 Real-World Debugging Scenarios
Scenario 1: Legacy Application with Extreme Complexity
Customer Profile:
- Retool version 2.x (legacy)
- Single-page app with 1000+ components
- Queries to MySQL and Snowflake in Europe, Retool hosted in Oregon
- 5-7 second latency per action, making app unusable
Triage Process:
- Examined Debug Tools Timeline to identify query execution patterns
- Found queries executing serially with multi-second Execute Resource times
- Identified large response sizes (>1MB) from several queries
- Measured cross-region network latency: ~150ms round-trip to Europe. Note that uswest to/from eu latency is 150ms AT BEST. Practically, the felt latency will be worse because there are dozens of network connections and large payloads which have to be transmitted over multiple ISPs leading to unpredictable bandwidth.
- Calculated component load overhead for 1000+ components
Root Causes:
- Extreme application complexity (1000+ components on single page)
- Cross-region data service latency
- Legacy Retool version without modern optimizations
- Serial query execution and large payloads
Recommendations:
-
Upgrade to Retool 3.x (v3.148+ recommended) - Immediate performance improvements from reduced bundle size and optimizations. Multipage apps (default architecture) provide faster load times.
-
Convert to multipage application - Distribute 1000+ components across multiple pages (target under 300 per page). Multipage apps only evaluate code and components on the current page.
-
Relocate data services or Retool - Move self-hosted Retool to Europe or relocate data services to Oregon. Eliminate 150ms cross-region latency.
-
Implement query caching - Enable caching for frequently accessed, relatively static data to reduce repeated query execution.
-
Optimize query execution - Configure independent queries to run in parallel. Implement server-side pagination to reduce response sizes.
Scenario 2: Low-End Device Performance Issues
Customer Profile:
- Retool 3.x self-hosted
- Multipage app with 300 components
- Queries to the database and the REST API in the same cloud region as Retool
- Significant latency on company-issued devices, but acceptable on developer laptops
Triage Process:
-
Measured device CPU performance using Speedometer 3.0
- Company devices: Low scores indicating weak CPUs
- Developer laptops: High scores (M1 Pro/Intel Core i7)
-
Tested network performance using speedtest.net (similar across devices)
-
Compared TTFQ on the empty app across device types
- Company devices: 8-10 seconds
- Developer laptops: 2-3 seconds
-
Reviewed Query Statistics: Execute Resource times were acceptable (less than 500ms)
Root Cause:
Insufficient CPU performance on end-user devices for JavaScript-heavy application processing. The issue is App Performance, not Query Performance.
Recommendations:
-
Offload processing to Retool Workflows - Move JavaScript transformations and complex logic from the browser to server-side Workflows. Expose workflows via webhooks and invoke from the app. This shifts computational burden from weak client devices to powerful servers.
-
Simplify client-side processing - Minimize transformers, reduce component count where possible, and eliminate unnecessary visual containers. Running heavy transformations on the client side for large datasets can slow down page interactivity.
-
Upgrade devices if feasible - If workflow migration doesn't sufficiently improve performance, consider hardware upgrades for affected users.
Scenario 3: Slow Data Rendering with Multiple Resources
Customer Profile:
- Retool 3.x
- Multipage app rendering financial data from 6-10 different resources
- The main data page has 1200 components
- Slow rendering and interaction on the primary dashboard page
Triage Process:
-
Examined Debug Tools Timeline
- Multiple queries executing, many with 1-3 second Execute Resource times
- Some queries returning large payloads (2-5MB)
-
Checked Query Statistics for longest queries
- Execute Resource times varied significantly between resources
- Several resources are not using server-side pagination
-
Tested direct queries to resources (bypassing Retool)
- Some resources are inherently slow (800ms+ for query execution)
-
Reviewed page complexity: 1200 components indicate a high complexity page.
Root Causes:
- Excessive page complexity (1200 components)
- Large query response sizes without pagination
- Some underlying data services with poor performance
- Potential for geographic distribution of resources
Recommendations:
-
Implement server-side pagination universally - Apply pagination to all large datasets across all 6-10 resources. This will dramatically reduce response sizes and improve rendering times. Rendering thousands of rows of data into a table impacts browser performance.
-
Optimize or scale data services - For resources with inherently slow queries, optimize database indexes, query structure, or consider scaling up compute resources.
-
Verify resource proximity - Ensure all 6-10 resources are geographically close to Retool. If not, consider migrating resources or changing the Retool deployment location.
-
Enable query caching - For financial data that doesn't change frequently, implement caching to share query results across users.
-
Reduce page complexity dramatically - Distribute the 1200 components across multiple context-specific pages. Remove purely decorative components. Consider breaking into multiple related apps if contexts are sufficiently distinct. Massive apps or page sizes can have high complexity with higher load times and memory usage.
3.3 Common Optimization Patterns
Pattern: High Component Count
Symptoms:
Slow initial page loads (high TTFQ), laggy interactions, consistent performance issues across all networks and devices.
Solutions:
- Convert single-page apps to multipage (distribute components across pages) - default architecture as of v3.148+
- Remove unnecessary visual containers and decorative elements
- Consider breaking very large apps into multiple separate apps for specific task sets
- Use modules to reuse components across your app, reducing redundancy
- Upgrade to Retool 3.x (v3.148+) for performance optimizations
Pattern: Cross-Region Latency
Symptoms:
High Execute Resource times (multiple seconds), performance varies by user location, query statistics show most time in Execute Resource phase.
Solutions:
- Move Retool Server closer to data services (same region)
- Move data services closer to Retool Server
- For Retool Cloud: Configure outbound region in Settings
- For Self-Hosted: Deploy in same cloud region and use private networking
Pattern: Large Payloads
Symptoms:
Large Response Size values (>1MB), slow page rendering after query completion, high Transfer Data and Frontend times.
Solutions:
- Implement server-side pagination (OFFSET/LIMIT or CURSOR) - especially for Table and List View components
- Select only necessary columns (avoid SELECT *)
- Apply filters closer to the data source rather than in Retool, such as through a Workflow.
- Consider data aggregation or summarization at the database level
- Fetch only necessary data and exclude hidden column data from queries
Pattern: Serial Query Execution
Symptoms:
Debug Tools Timeline shows queries executing one after another; total load time equals the sum of individual query times.
Solutions:
- Configure independent queries to run in parallel (set to run 'On page load' asynchronously)
- Review query dependencies and minimize unnecessary chaining
- Use query success handlers sparingly (they force serial execution)
- Consider using query JSON as SQL or JavaScript transformers to reduce the number of requests
Pattern: Weak Client Devices
Symptoms:
Low Speedometer 3.0 scores, performance issues persist even with a good network, the issue affects a specific user population with similar hardware, and empty apps show high TTFQ.
Solutions:
- Move processing to Retool Workflows (server-side execution)
- Minimize client-side JavaScript transformers and move to server-side processing when possible
- Reduce application complexity (component count)
- Consider device upgrades if software optimizations are insufficient
Additional Resources
Retool Documentation
- Debug Tools - https://docs.retool.com/apps/concepts/debug-tools
- Web App Best Practices - https://docs.retool.com/apps/concepts/best-practices
- App Performance Monitoring - https://docs.retool.com/apps/guides/observability/performance-monitoring
- Query Performance - https://docs.retool.com/queries/concepts/performance
- Query Performance Best Practices - https://docs.retool.com/queries/concepts/best-practices
- Query Caching - https://docs.retool.com/queries/concepts/caching
- Modules - https://docs.retool.com/apps/guides/layout-structure/modules
Retool University
- Advanced Developer Performance Course + Lab - https://docs.retool.com/education/labs/development/performance
Performance Testing Tools
- Speedometer 3.0 (CPU Performance) - https://browserbench.org/Speedometer3.1/
- Speedtest (Network Performance) - https://www.speedtest.net/
Conclusion
Retool application performance is the result of multiple interconnected factors spanning application architecture, query design, infrastructure configuration, and client capabilities. By understanding how Retool operates (Lens 1), following best practices during development (Lens 2), and applying systematic debugging when issues arise (Lens 3), developers can create and maintain high-performance applications that delight end users.
Multipage apps are now the default in current stable releases, providing faster load times by only evaluating code and components on the currently active page. Modern components like Table and List View are virtualized by default, optimizing performance by rendering only visible items. These platform improvements, combined with the strategies outlined in this guide, enable developers to build performant applications at scale.
Remember that performance optimization is not a one-time activity but an ongoing practice. Monitor performance metrics throughout development using Debug Tools, conduct regular reviews of production applications, and stay current with Retool platform improvements. The investment in performance pays dividends in user satisfaction, productivity, and reduced support burden.
For applications experiencing performance issues, start with the systematic debugging approach outlined in Lens 3. Most performance problems fall into recognizable patterns with proven solutions. When in doubt, measure first, form hypotheses second, and test solutions systematically. Utilize Retool's built-in Debug Tools, Performance tab, and Linting tab to identify bottlenecks and optimization opportunities.