Retool App Performance
This laboratory focuses on diagnosing and resolving performance issues within a Retool app.
Requirements
To walk-through the performance lab, you will need to import an application that has a performance issue.
- Click the here to download the JSON.
- Once the template has downloaded go to Retool Home Screen, select Apps > Create > Classic App.
- The Classic App editor will display, rename the app
performance-app. - In the upper-right, select ... > Replace app with JSON/ZIP.
- Select the downloaded file
performance-app.json.
Steps
The application imported into Retool is built with a performance issue. The following steps will examine the performance issue using Retool's Debug features.
API Overview
In order to demonstrate query latency, an API that can enable or disable performance issues is used. The API URL is displayed below with explanations of its path and query parameters.
https://qe1mvn42vg.execute-api.us-east-2.amazonaws.com/shipments/2?disableDelay=false
In the URL above, a path parameter specifying the page of results to return 2 and a query parameter to specify whether to enable a delay/error or not is provided, disableDelay = true | false.
Diagnosing performance issues in the app
Before we dive into solving a problem, we need to collect data about the problem and the symptoms that we are seeing. Let’s understand what Retool provides to help collect that data and provide a way to guide a developer to isolate and potentially solve the problem.
Performance
- Performance v3.148.0 Cloud / Self-hosted
- Performance Pre-v3.148.0 Cloud / Self-hosted
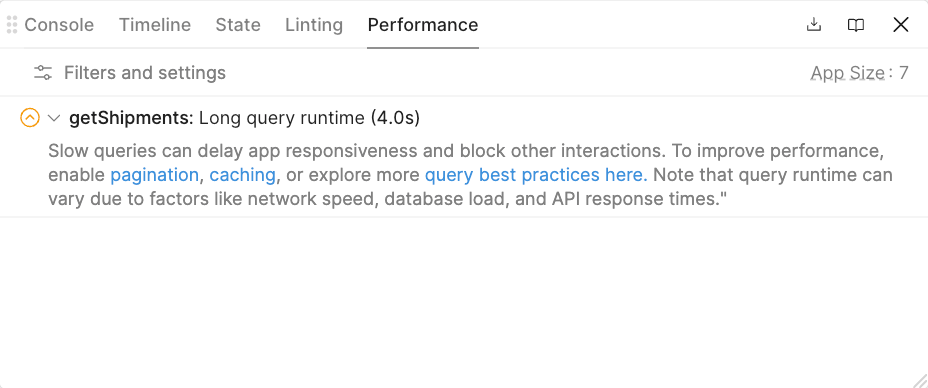
Within Retool, select Debug > Performance. This will display the Performance linter entries showing any performance issues identified. The following image provides an identification of a long query time in the getShipments call.
Network Speed Test
Next let’s look at the network speed. Go to the following app and run to collect details regarding your network speed as shown in the following figure.
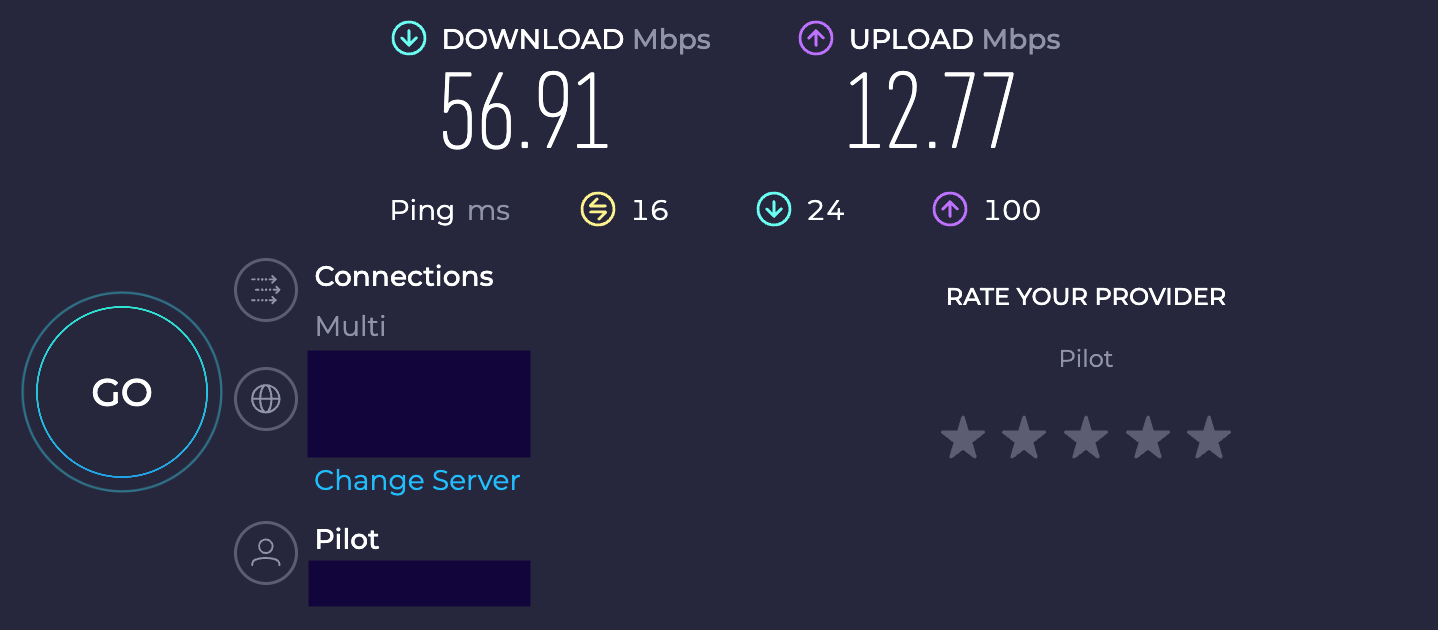
The results of this test show a download speed of 56.91 Mbps or Megabits per second which is sufficient for moderate browsing / video streaming.
CPU Test
Next we should understand what the performance of the CPU is as this impacts performance of JS processing, CSS processing etc. Use the following app to collect these details.
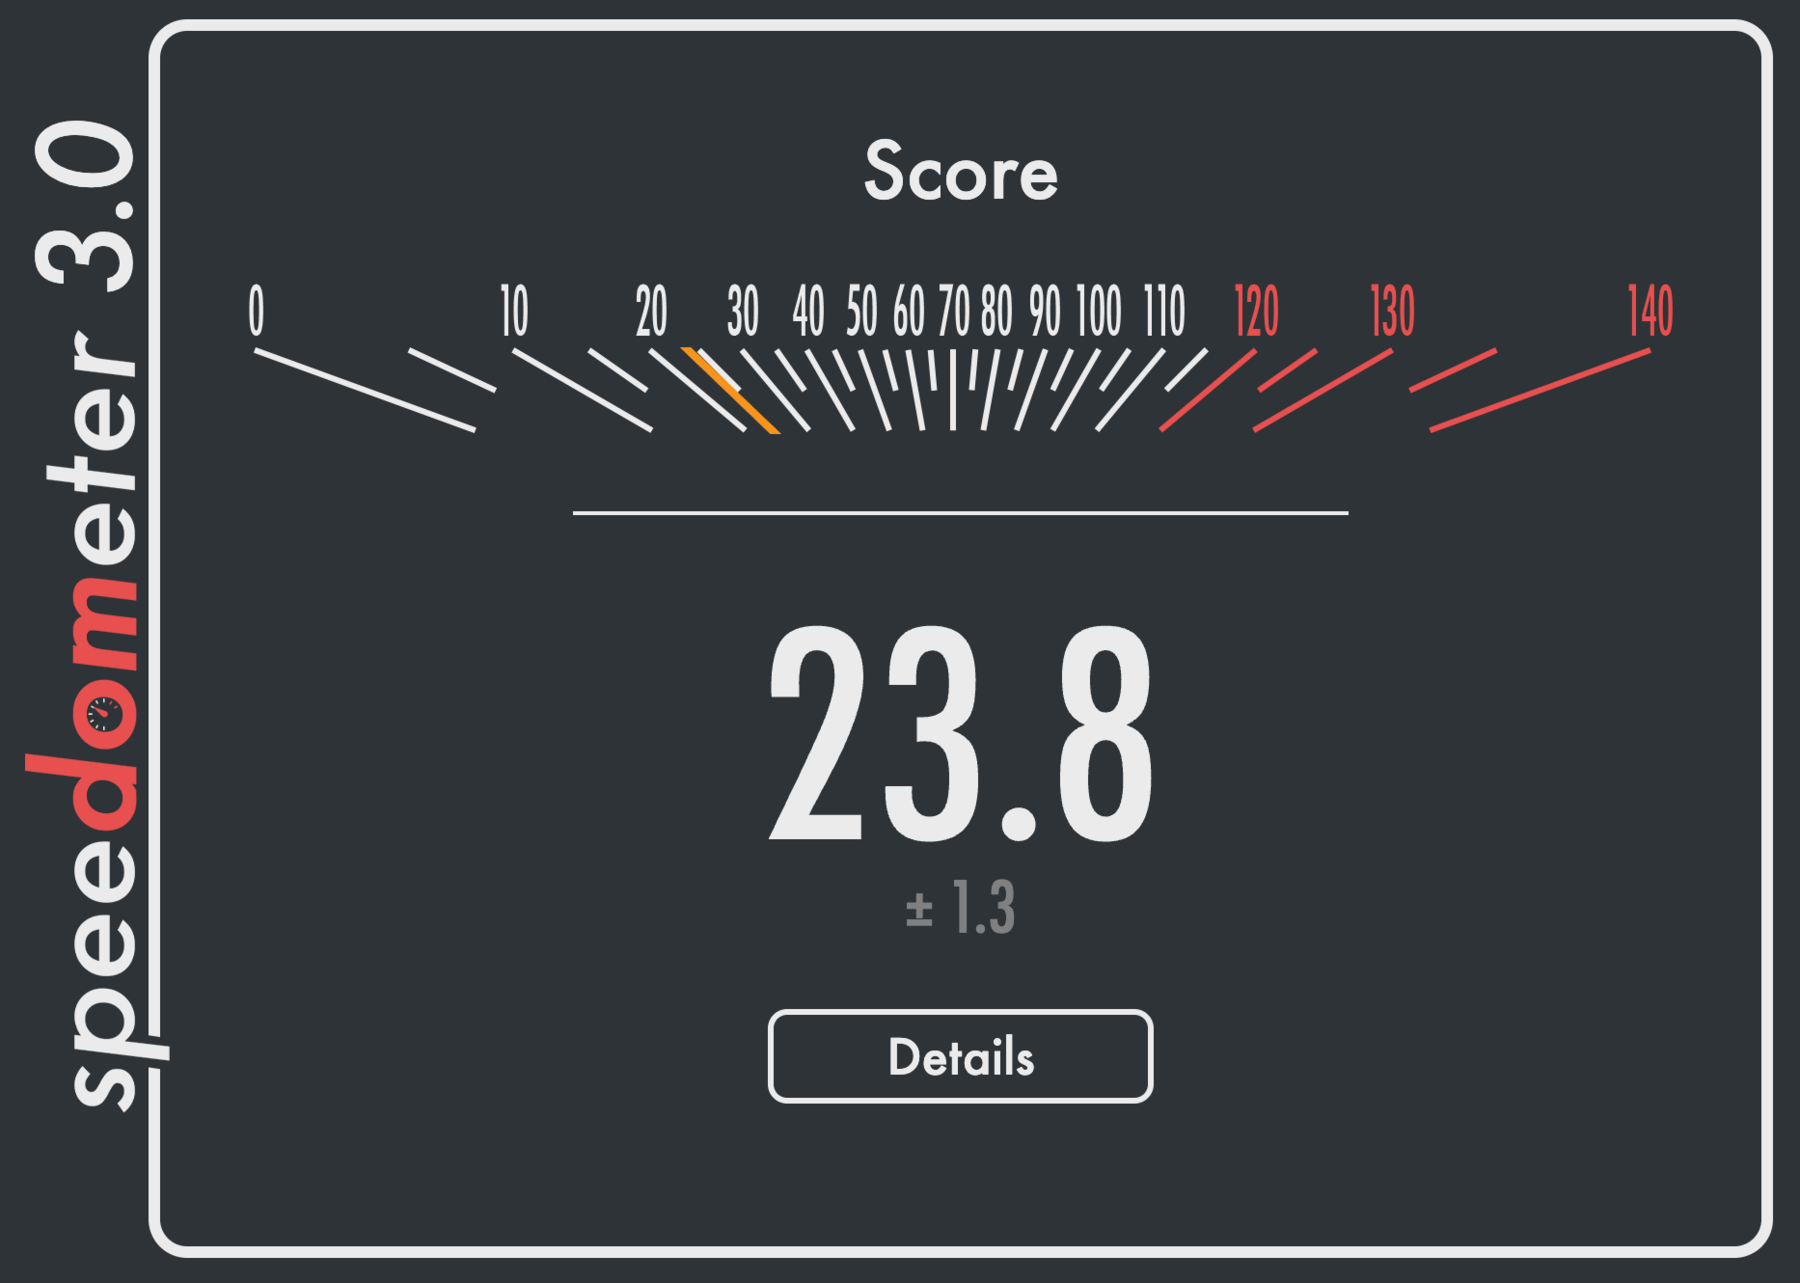
Details of Speedometer show its use to help evaluate the performance using browser tests. The previous image is an example of running the Speedometer on a Macbook Pro M1 processor where the result provides a relative value. For most laptops, a value between 20 and 30 would be common. The higher the value, the more performance the processor provides. If this value is between 0 and 20, the CPU ranked lower in browser performance and could impact the performance of Retool apps, running in a browser.
Query Stats and Timeline
Looking at the previous results, the network speed test and the CPU test didn’t identify any significant environment issues that could impact the performance of the app. In performance, we can see a query that is running slowly (4+ seconds). Let's more closely examine the query. In Debug > Timeline we can see if we have a chain of queries being executed. In this example it is a single query as shown below.

Let’s dive deeper into the query stats. Access query stats by going to Code > getShipments. Hover over the time (e.g., 4.4s) to get a breakdown of the query.

So we can see the Total time (4.4s). This consists of Prepare query, Backend, Frontend, and Response size. We can see the time is being spent in the Backend and specifically, 4.1s in execute resource. This is Retool’s backend invoking and waiting for a response from the REST API. The overall size of the response is relatively small, 4.0KB, and thus would not explain the 4.4 second time window.
Performance summary
With the previous data we see the following:
- The application Query Stats show slow queries of 4+ seconds.
- The performance tab identifies the slow query.
- The network and CPU tests do not identify any specific issues that could explain latency in the application with average networking speed and CPU.
- Query stats identifies that the backend processing consumes most of the query time and that the data downloaded is 4.0 Kb (Kilobytes), a small data set.
What we can ascertain is that the REST API should be more closely examined. Quickly testing the API in tools such as Postman could help independently verify that the REST API speed is an issue outside of Retool.
Rerun Query with disableDelay = true
Let’s rerun the query but first update the REST API endpoint to use an updated query parameter of disableQuery = true. This will disable the artificial delay in the REST API and return the response as quickly as possible. Go to Code > getShipments. Modify the REST endpoint to the following where the disableDelay is set to true.
https://qe1mvn42vg.execute-api.us-east-2.amazonaws.com/shipments/2?disableDelay=true
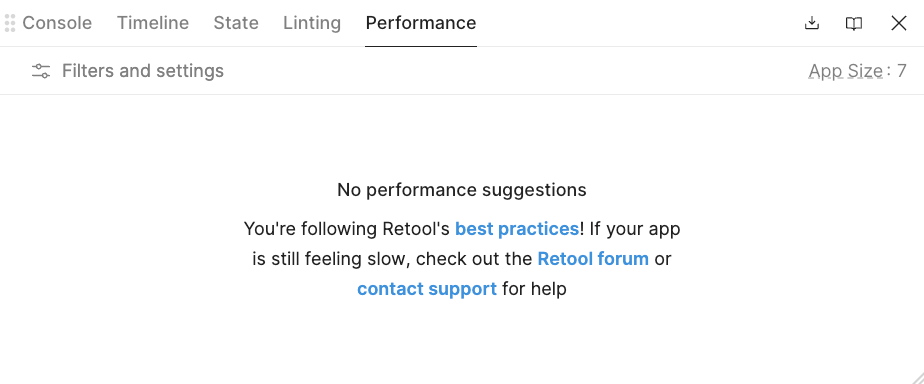
Go to Debug > Performance. You will see that no issues appear for the getShipments API call.
Performance post query change
Let’s do a closer examination of the query stats and compare with what we had previously.

In this query we can see the time has reduced from the original 4.4s to 941ms. The majority of this time is spent in Backend with an almost equal distribution of execute resource and transfer data. The response size is unchanged.
Within Retool, select Debug > Performance. This will display the Performance tooling showing the complexity / performance of the application. The following image provides a snapshot of the sample app.
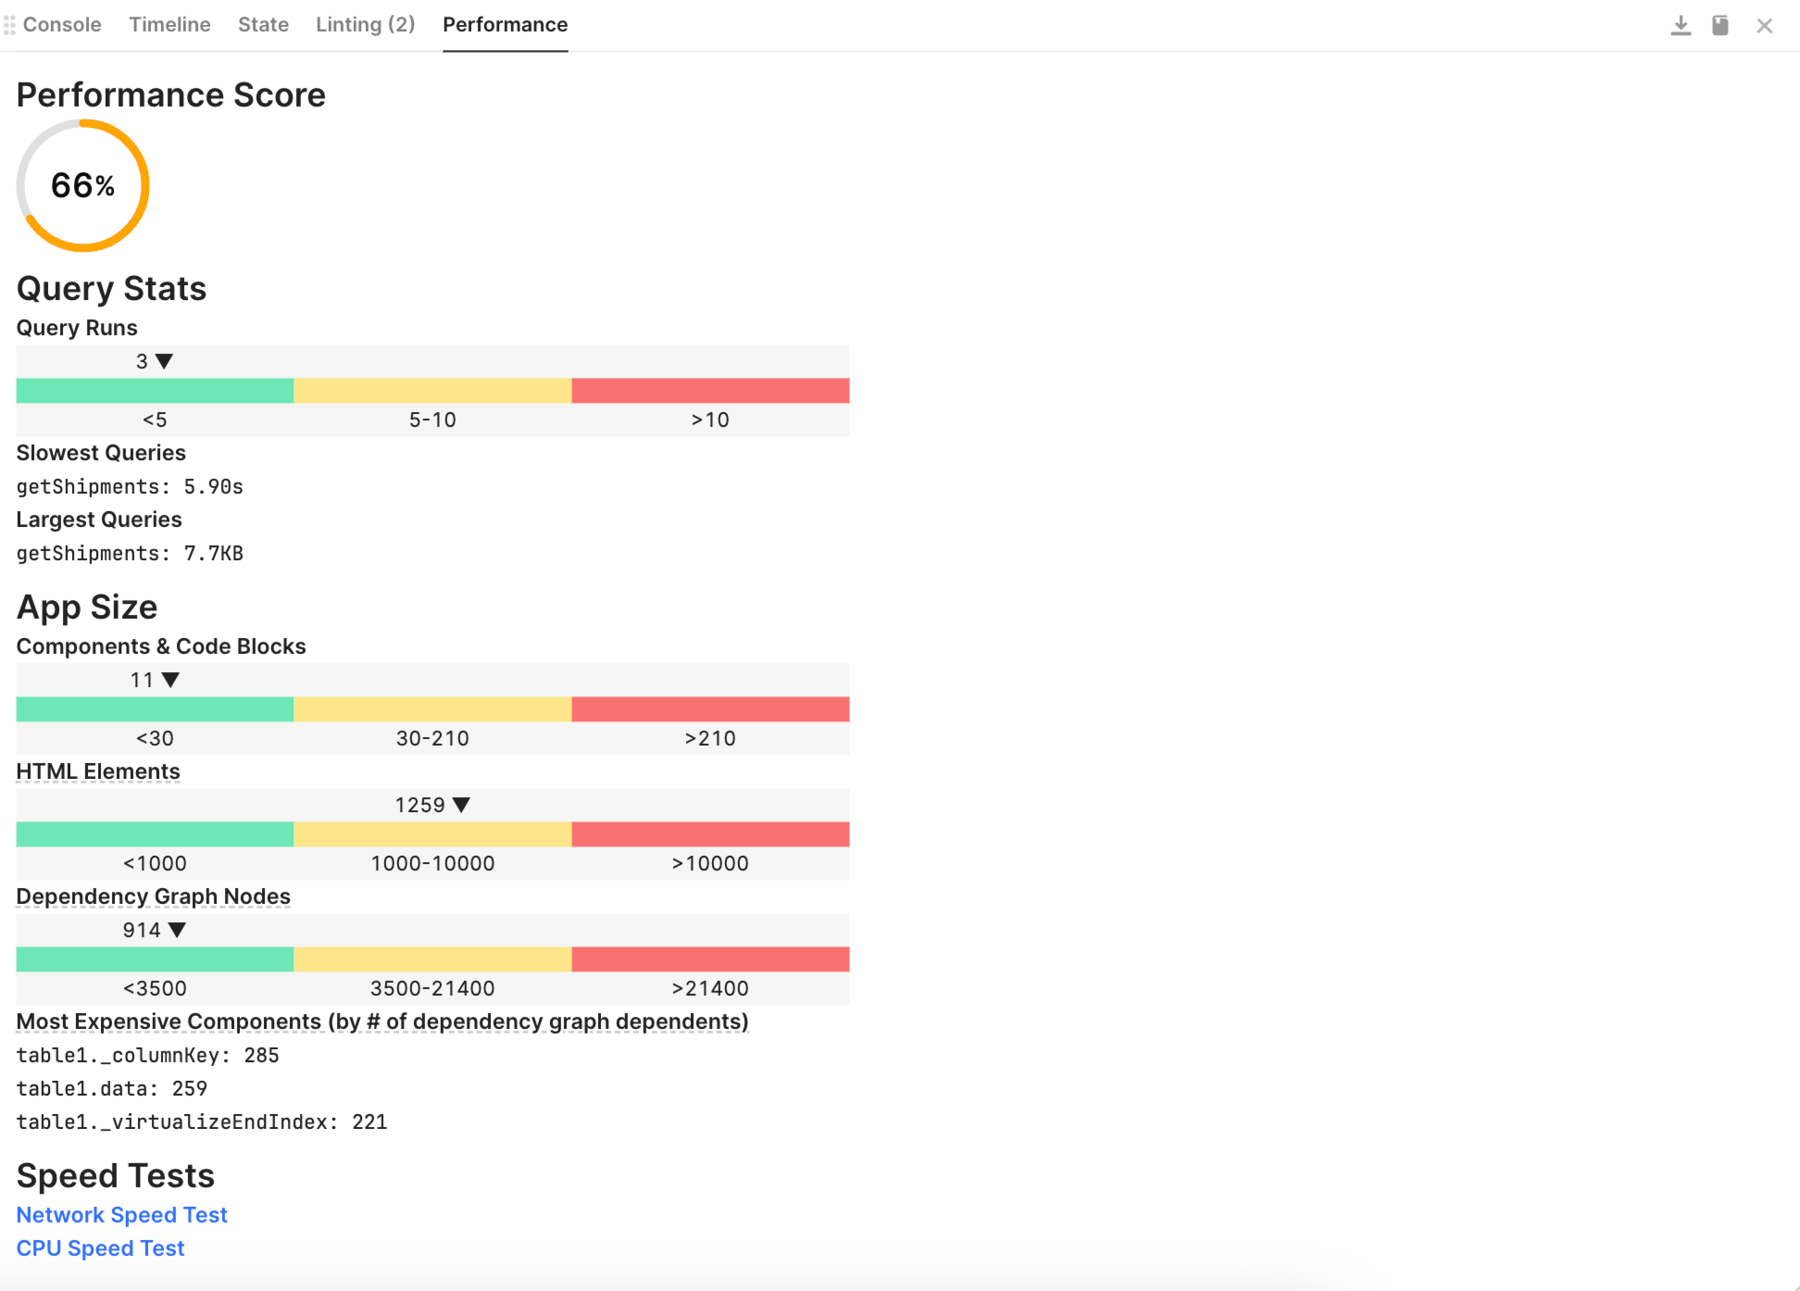
The performance score for this example shows 66. From Retool documentation, the performance score is ... "The performance score is calculated using the query stats and app size values and linearly interpolating between p50 and p95 values gathered across Retool. For example, an app that is more performant than 95% of all apps across Retool achieves a perfect score for that category."
If you examine the page it provides Query Stats, App Size, and Speed Tests. Quickly scanning the performance metrics, the Query Size shows Slowest Queries of 5.90 seconds. The App Size shows a small number (in the green) for Component & Code Blocks, HTML Elements, and Dependency Graph Nodes and identifies the most expensive components.
Network Speed Test
Next let’s look at Speed Tests. Select Speed Tests > Network Speed Test. This will display network details as shown in the following figure.
The results of this test show a download speed of 56.91 Mbps or Megabits per second which is sufficient for moderate browsing / video streaming.
CPU Test
Next we should understand what the performance of the CPU is as this impacts performance of JS processing, CSS processing etc. Select Speed tests > CPU test.
Details of Speedometer show its use to help evaluate the performance using browser tests. The previous image is an example of running the Speedometer on a Macbook Pro M1 processor where the result provides a relative value. For most laptops, a value between 20 and 30 would be common. The higher the value, the more performance the processor provides. If this value is between 0 and 20, the CPU ranked lower in browser performance and could impact the performance of Retool apps, running in a browser.
Query Stats and Timeline
Looking at the previous results, the network speed test and the CPU test didn’t identify any significant environment issues that could impact the performance of the app. In performance, we can see a query that is running slowly (5+ seconds). Let's more closely examine the query. In Debug > Timeline we can see if we have a chain of queries being executed. In this example it is a single query as shown below.
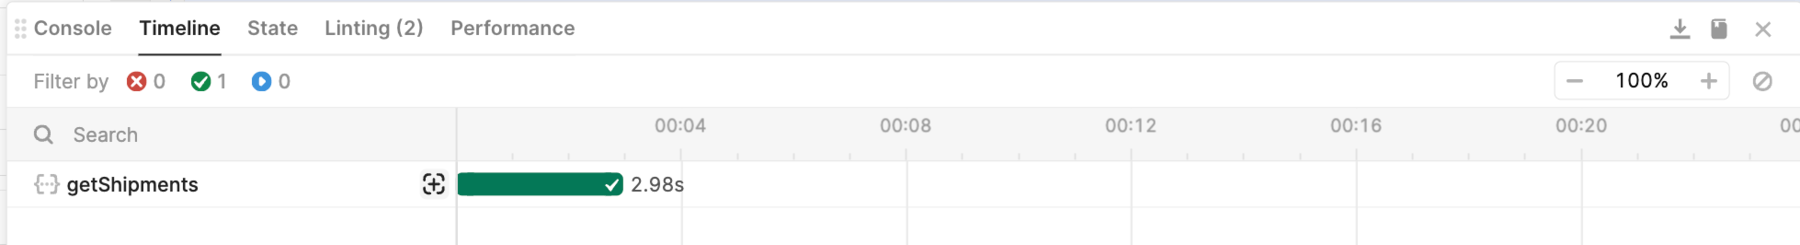
Let’s dive deeper into the query stats. Access query stats by going to Code > getShipments. Hover over the time (e.g., 2.98s) to get a breakdown of the query.
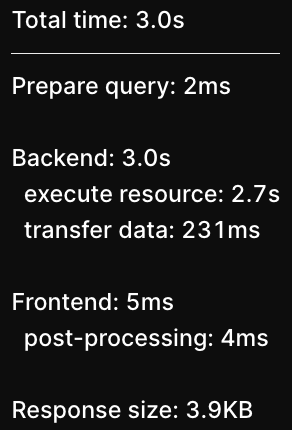
So we can see the Total time (3.0s). This consists of Prepare query, Backend, Frontend, and Response size. We can see the time is being spent in the Backend and specifically, 2.7s in execute resource. This is Retool’s backend invoking and waiting for a response from the REST API. The overall size of the response is relatively small, 3.9KB, and thus would not explain the 3.0 second time window.
Linting
Linting provides another mechanism to be informed of performance issues. Let’s examine the details of the Linting errors that should be displayed:

The first identifies the query speed and some suggestions for using pagination or caching. The second identifies the number of columns in the table and that reducing the number of columns could potentially help as well.
Performance summary
With the previous data we see the following:
- The application Query Stats show slow queries of 5+ seconds.
- The application App Stats shows components, HTML and dependencies in the green range (simple vs. complex app).
- The network and CPU tests do not identify any specific issues that could explain latency in the application with average networking speed and CPU.
- Linting identifies a slow query and suggestions on reducing column count.
- Query stats identifies that the backend processing consumes most of the query time and that the data downloaded is 3.9 Kb (Kilobytes), a small data set.
What we can ascertain is that the REST API should be more closely examined. Quickly testing the API in tools such as Postman could help independently verify that the REST API speed is an issue outside of Retool.
Rerun Query with disableDelay = true
Let’s rerun the query but first update the REST API endpoint to use an updated query parameter of disableQuery = true. This will disable the artificial delay in the REST API and return the response as quickly as possible. Go to Code > getShipments. Modify the REST endpoint to the following where the disableDelay is set to true.
https://qe1mvn42vg.execute-api.us-east-2.amazonaws.com/shipments/2?disableDelay=true
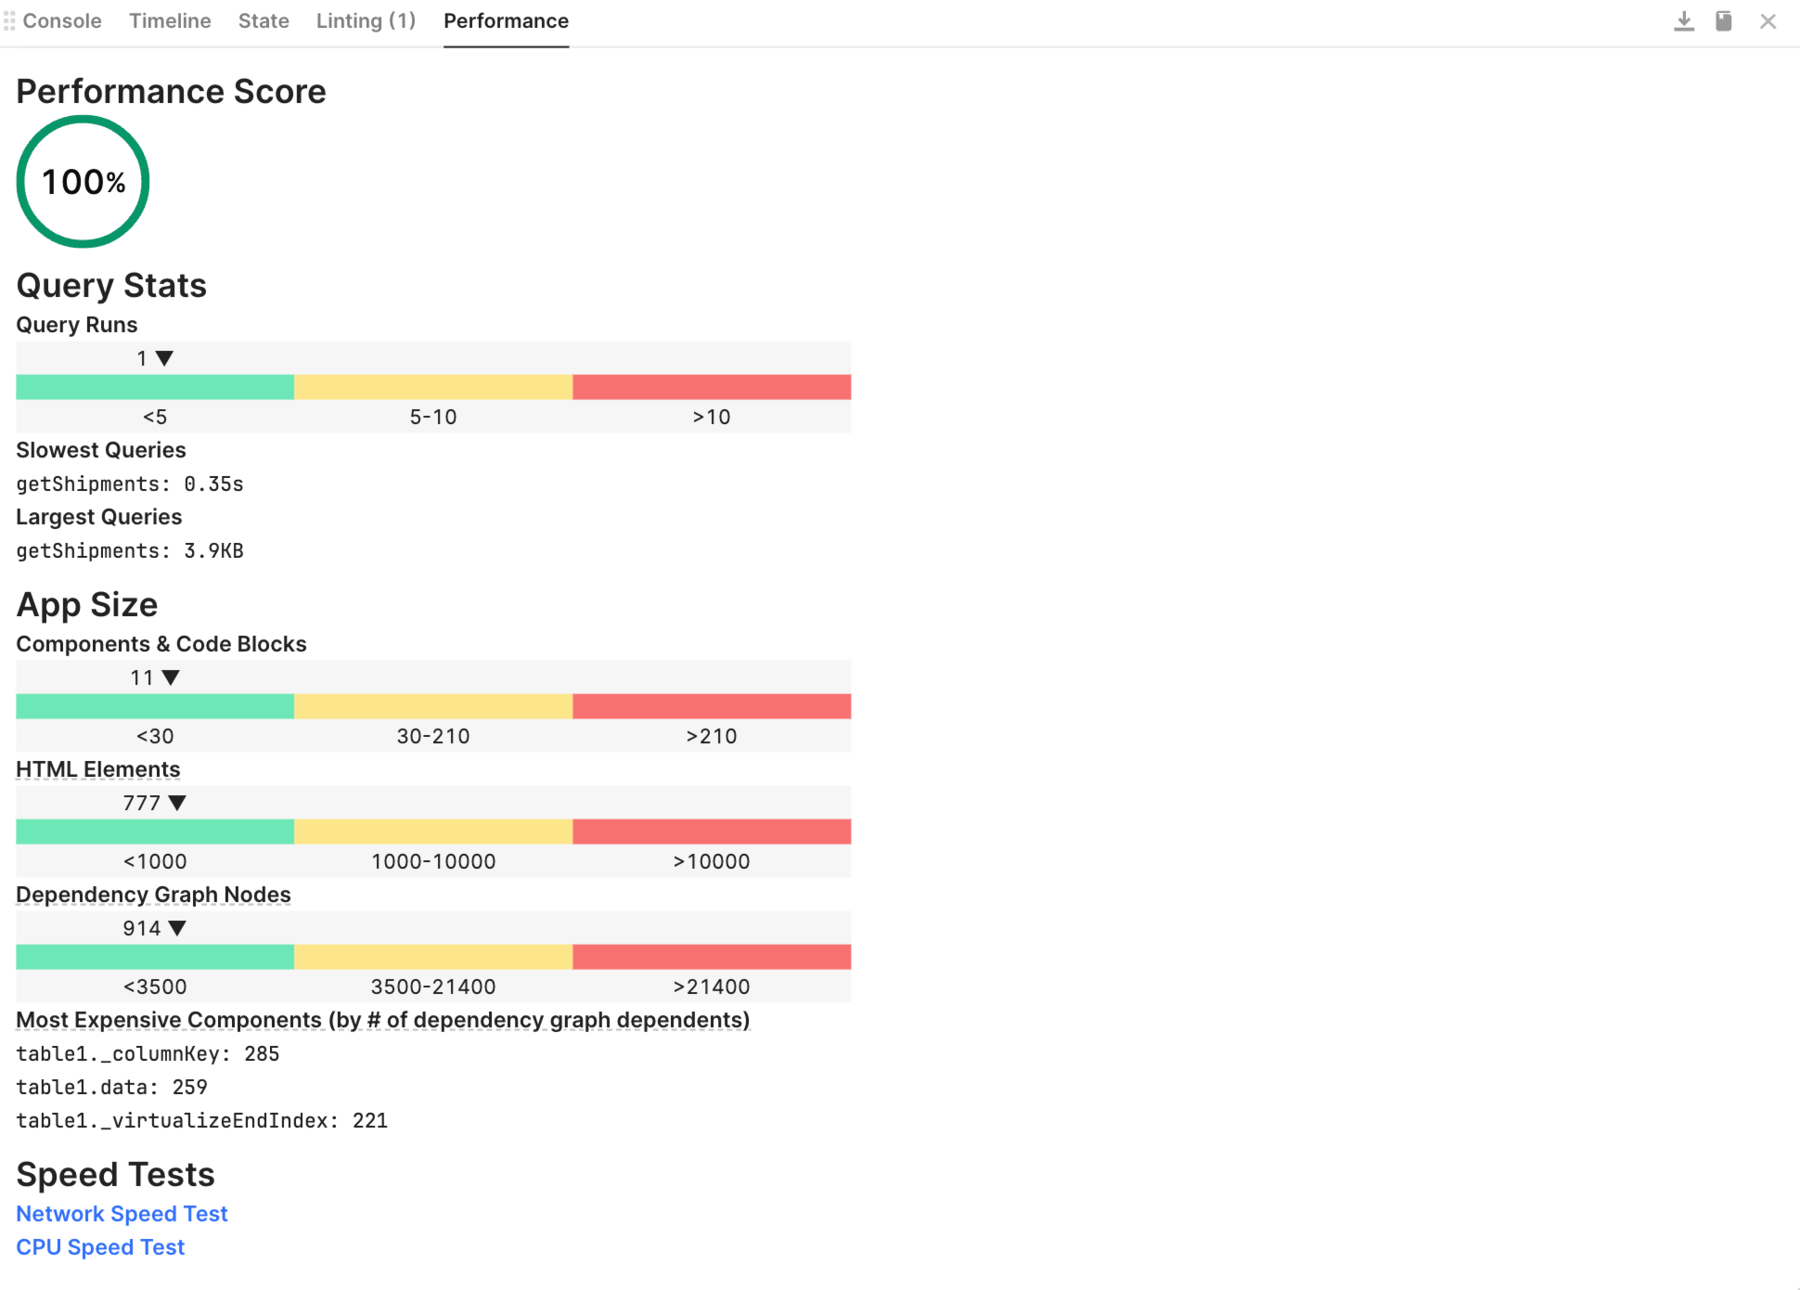
Go to Debug > Performance and examine the performance score. It has increased from 66 to 100 and shows as green/healthy.
Performance post query change
Let’s do a closer examination of the query stats and compare with what we had previously.
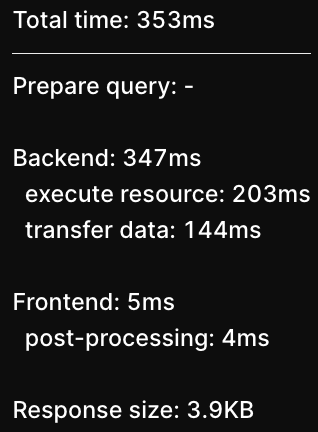
In this query we can see the time has reduced from the original 3.0s to 353ms. The majority of this time is spent in Backend with an almost equal distribution of execute resource and transfer data. The response size is unchanged.
Summary
This lab focused on using metrics to isolate why a particular app was not as performant as it could be. From these metrics, we could slowly isolate where the issue was and compare that with a properly functioning REST API. This laboratory does not demonstrate slow performance when the Retool App is composed of a large number of components and large dependency chains (800+ components). Retool currently has in private beta, Multipage, a way to create multiple pages within a single Retool App, helping reducing the complexity / long depedency chains. Current best practices focus on splitting a single app into multiple apps and the use of navigation to combine them into a virtual app.