Styling a Retool App
The following lab covers modification of the appearance of a Retool application to help improve the UX design / interpretability of an application. The starting point is the Multipage inventory management app.
Requirements
- Administrative access to Retool Database and Storage
- Complete the Retool Database and Storage Lab to have data that will display in the Retool app.
- Import the Multipage Inventory Management Application.
Steps
Import the Retool Multipage Inventory Management Application
To start this laboratory we need to download and import the Multipage Inventory Management Application as a starting point if you haven't completed the lab previously.
- Click the link to download the JSON.
- Once the template has downloaded go to Retool Home Screen, select Apps > Create > Classic App.
- The Classic App editor will display, rename the app
inventory-mgmt-app. - In the upper-right, select ... > Replace app with JSON/ZIP.
- Select the downloaded file
inventory-mgmt-app.json.
Inventory Page Styling
In this section we will complete the following actions:
- Simplify the table interface to reduce the amount of information displayed to only what is required.
- Change the part quantity column to a color-coded tag displaying excess / low inventory levels.
- Adjust alignment / centering of table contents.
- Update tabs display in tabbed container.
- Style components to have increased radius and medium shadow.
- Update charts to include titles.
Simplify table
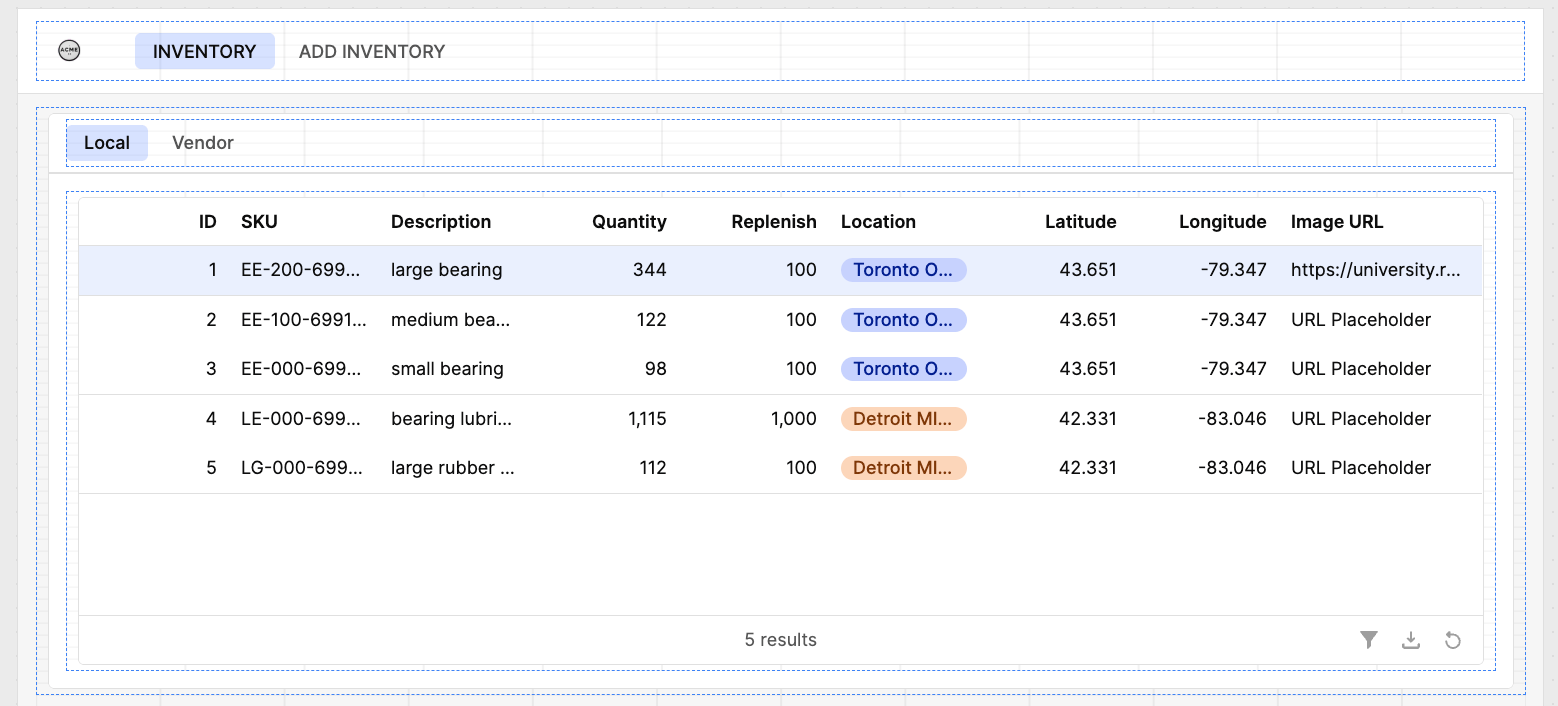
The inventory page has a table that presents available inventory to the user of the application. Currently the table presents too much information to the user including the ID(primary key), latitude, longitude, image_url. Let's simplify the interface by hiding this information. The following image shows are starting point:
- Select the inventory page and then the inventoryTable component.
- Under Content the table columns display, select the
IDfield and ... > Hide column. Repeat this process and hidelatitude,longitude, andimage_url.
The following demonstrates the previous steps:
Color-coded quantity
Next we want to provide a visual cue that inventory quantity is above or below the replenish value for a part. Using JavaScript we can calculate the difference between quantity and replenish columns and color code the quantity in green (above or equal to replenish) or red (below replenish). To make it visually pop, we will change the quantity column display from String to Tag.
- Select the
inventoryTablecomponent. - Select Quantity > Format and change it from
StringtoTag. - Under Appearance > Assign color tags automatically, deselect the checkbox. This will make the Color property appear.
- Enter the following JavaScript (a ternary operator) into the Color property.
{{(currentSourceRow.quantity - currentSourceRow.replenish) > 0 ? '#90EE90':'#ffcccb' }}
The following demonstrates the previous steps:
Adjust alignment / centering of table contents
With additional space in the table, we can adjust the size of the columns by dragging each and sizing accordingly.
- Select the
inventoryTablecomponent. - In the column area, drag and slide the columns to increase the size.
- In the Right panel, select each column and under Appearance > Align select the center symbol. Repeat this process for each column.
The following demonstrates the previous steps:
Update tabs display in tabbed container
To demonstrate the flexibility of Retool styling, we can change the look and feel of the tabs in the tabbed container. The default is a pill display but we can alter this to a line display.
- Select the tabs in the tabbed container (e.g., Local or Vendor)
- In the Right panel, select Appearance > Variant > Line.
The following demonstrates the previous steps:
Style components with radius and shadow
The inventory page has a tabbed container and table component. We want to add a radius and shadow to each to improve the look.
- Select
tabbedContainer1component and in the Right panel select Appearance > Styles > + - Select Border radius and enter a value of 8px.
- Select Shadow which sets a default
Medium elevation. - Repeat this process with
inventoryTablecomponent.
The following demonstrates the previous steps:
Update charts
Currently the charts do not have titles, making the interpretability of the data more challenging. Let's add titles to each chart.
- Select Vendor tab to display the two charts.
- Select the left chart,
localInventoryChart. - Select in the Right panel, Add-ons > Title.
- Enter title of
Local Inventory. - Select the right chart,
vendorInventoryChart. - Select in the Right panel, Add-ons > Title.
- Enter title of
Vendor Inventory.
The following demonstrates the previous steps:
addInventory Page Styling
- Style components to have increased radius and medium shadow
- Adjust label location
Style components with radius and shadow
Similar to the previous radius and shadow styling additions, the addInventory container and form components can be updated.
The following demonstrates the previous steps:
Adjust label location
In the form, the labels currently are placed horizontally to the input fields. To help conserve space, we can left-align the labels with the input fields.
- Select the SKU label and under Appearance > Position select
Left. - Repeat this process for each label.
The following demonstrates the previous steps:
Learn more about design
If you are interested in learning more about design, the Retool Advanced Developer Path in Retool University has a Design course and Design Lab.