Getting started with Mapbox Map
Learn how to use Mapbox Map to display coordinates and other information on a map.
Use Mapbox Map to display points of interest on an embedded map using MapBox. It supports custom markers using emoji and symbols, default coordinates and zoom level, and GeoJSON to render custom shapes for highlighting locations.
Features
Key features of Mapbox Map include:
- Display markers and objects on the map.
- Select default coordinates and zoom level.
- Configure interaction on viewport change, selection, and hover.
- Customize marker and object appearance.
Specify content options
The Content section of the Inspector contains settings that control the content of the Mapbox Map. Use the Latitude and Longitude settings to define the default center of the map. Use this section to define the markers or shapes that you want to appear on the map.
You can display both markers and shapes at the same time, but you must use the Points setting for markers and the GeoJSON setting for lines and shapes.
Display markers
To display markers on the map, use the following settings:
- Latitude field name and Longitude field name, which define the object keys that Retool uses for the latitude and longitude value.
- Points, an array of points to render. Each point is represented by an object with keys that match those defined in Latitude field name and Longitude field name.
For example, you could create an SQL query getLocations that returns all franchise locations in Texas. This table includes ten entries, each with a latitude and longitude value.
Add a Mapbox Map to the canvas, and set the Points value to {{ formatDataAsArray(getLocations.data) }}. This ensures that the data is formatted as an array and that you can set the points dynamically.
You can also create a query that gets your current location information using the getCurrentPosition() method, and use this query to populate your coordinates on the map. Note that your browser must have access to your location information in order to use this method.
Display shapes
To display shapes, use the GeoJSON setting. Data must be formatted in GeoJSON format, in accordance with RFC 7946. You can use the online tool geojson.io to place lines or shapes on an interactive map and generate the corresponding JSON that is accepted by the GeoJSON setting.
The following example shows how you can use GeoJSON to create a polygon on the map:
- **GeoJSON** Setting Value
- Mapbox Map
{
  "type": "FeatureCollection",
  "features": [
    {
      "type": "Feature",
      "properties": {},
      "geometry": {
        "coordinates": [
          [
            [
              -77.26840246337339,
              39.03015226809225
            ],
            [
              -77.26840246337339,
              38.75986554487136
            ],
            [
              -76.80535320479785,
              38.75986554487136
            ],
            [
              -76.80535320479785,
              39.03015226809225
            ],
            [
              -77.26840246337339,
              39.03015226809225
            ]
          ]
        ],
        "type": "Polygon"
      }
    }
  ]
}

Configure user interaction
The Interaction section of the Inspector contains settings that control user interaction. Mapbox Map supports a series of event handlers that enable you to trigger a query on each occurrence. Choose an existing query to trigger, or create a new one.
For example, you could create a map that displays a marker for each franchise of your business, and you want to display the name of the franchise owner when you click on a point. Create a JavaScript query called getDetails that contains the code return mapboxMap1.selectedPoint.
Add a Text component to the screen, and set the Value to ## {{ getDetails.data.manager_name }}. Finally, update the Mapbox Map component so that On point select triggers getDetails.
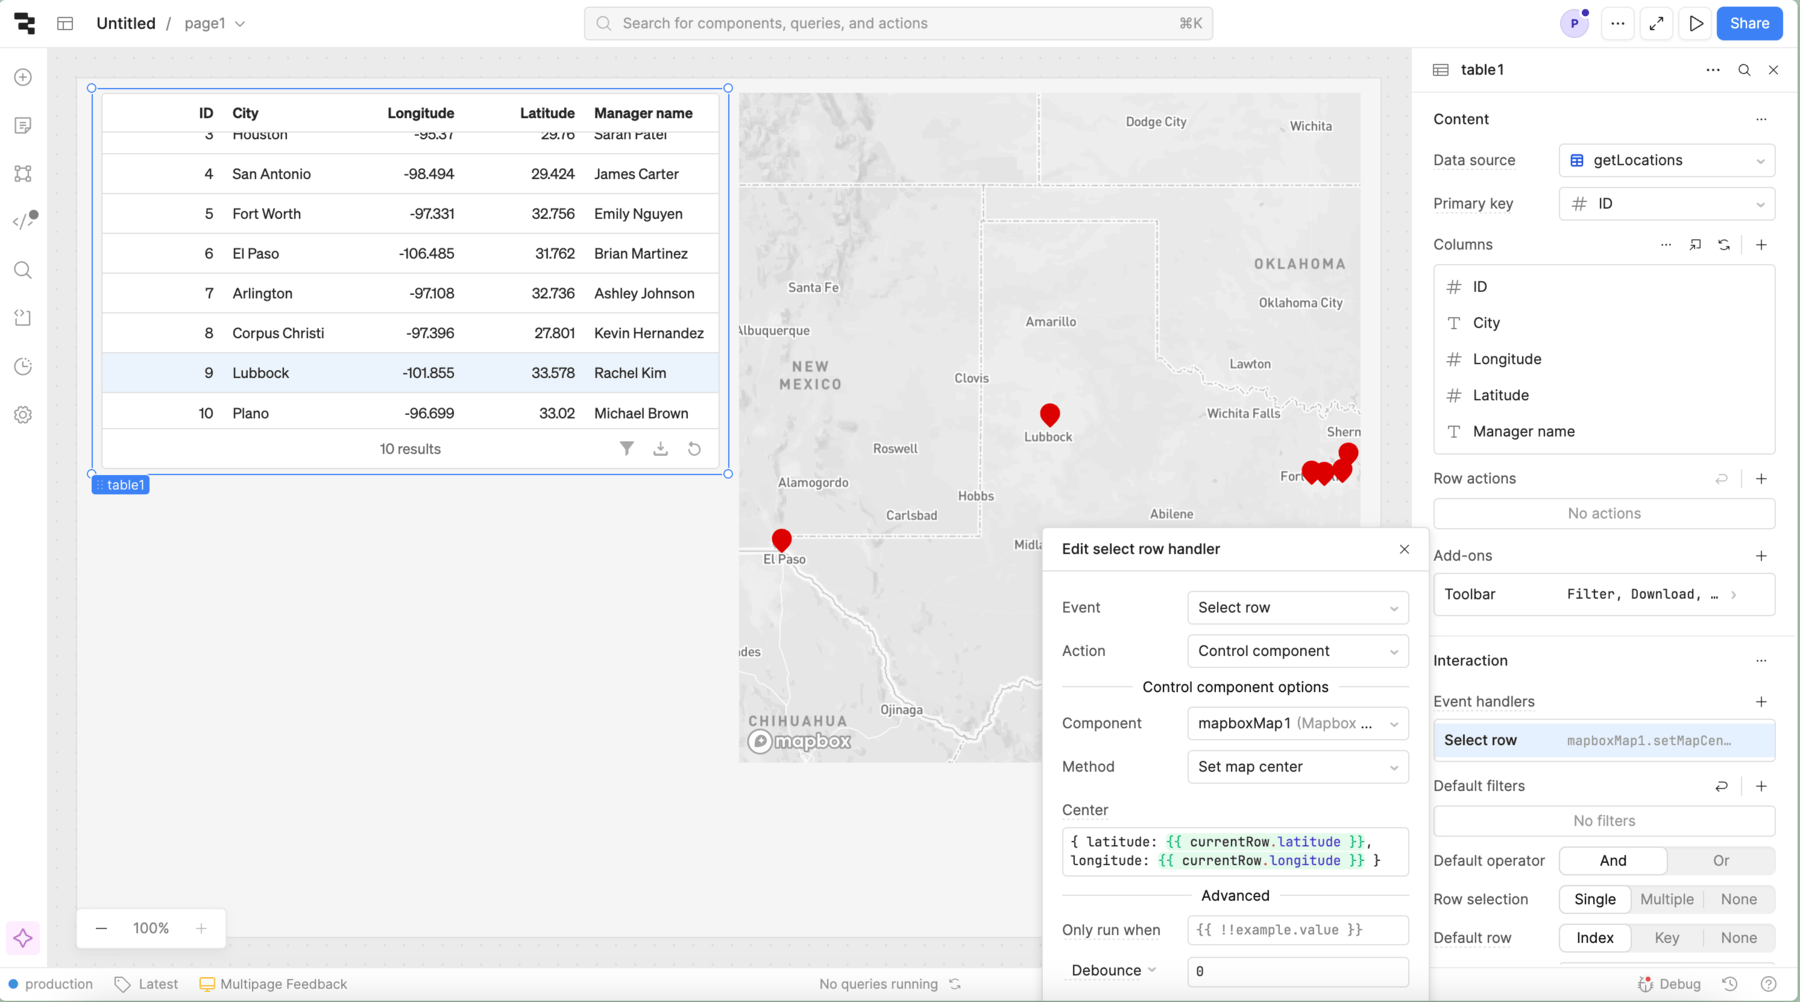
Alternatively, you can control the Mapbox Map component using the event handler of another component. For example, you can use a Table event handler to set the center of the map based on the selected row.
Customize appearance
You can customize the presentation of your component in the Spacing and Appearance sections of the Inspector.
You can dynamically control the Hidden setting with a truthy value that evaluates to true or false. You can also control the hidden property for the component using the .setHidden() method from event handlers and JavaScript queries.
The Zoom setting defines the scale of the map by default. You can also set this to a dynamic value (such as the value of a Slider). Users can also zoom and manipulate the map themselves.
You can apply GeoJSON Layer Styling to your GeoJSON data, if applicable. GeoJSON uses CSS styles. Refer to the Mapbox Style Specification for more information.