Collect app usage analytics
Learn how to integrate with Segment or Google Analytics to collect usage data.
| Usage Analytics Availability | |||
|---|---|---|---|
| Cloud | Generally Available | ||
| Self-hosted Edge 3.33 or later | Generally Available | ||
| Self-hosted Stable 3.33 or later | Generally Available | ||
Retool’s analytics feature allows you to collect analytics from your apps, and it supports integrations with Segment and Google Analytics.
Your organization must be on the Enterprise plan to use analytics features.
Get started
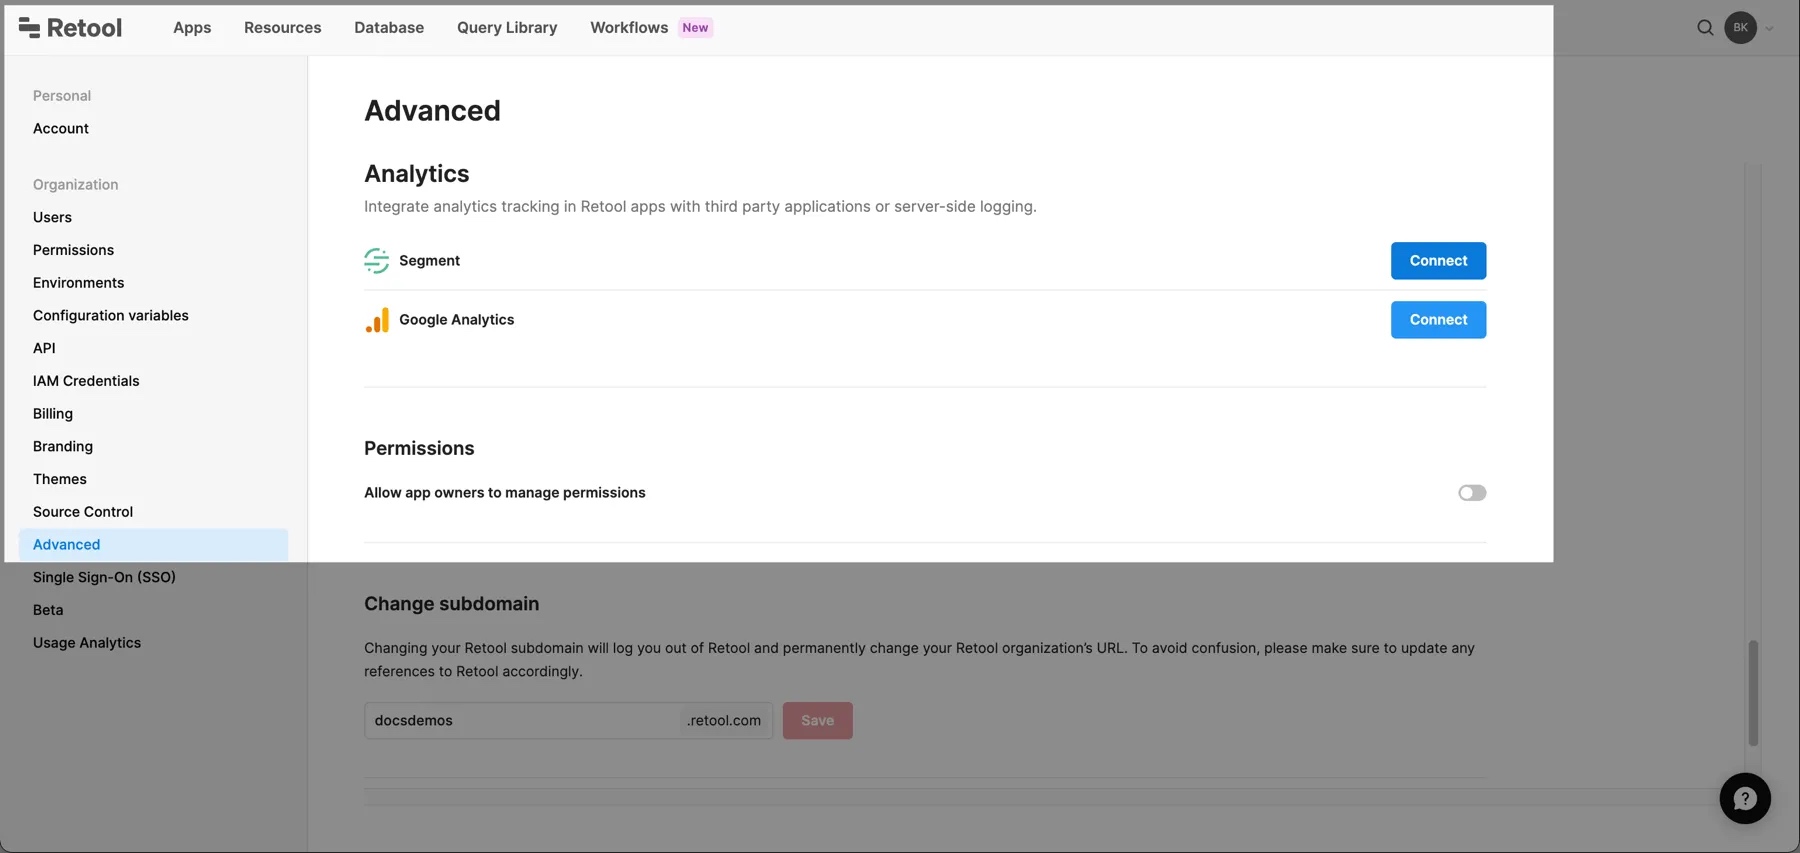
There's an Analytics section on the Settings > Advanced tab in Retool. From there, you can connect to Segment and Google Analytics. You can also log to standard out. After connecting, events are sent to all enabled integrations.
Configuration
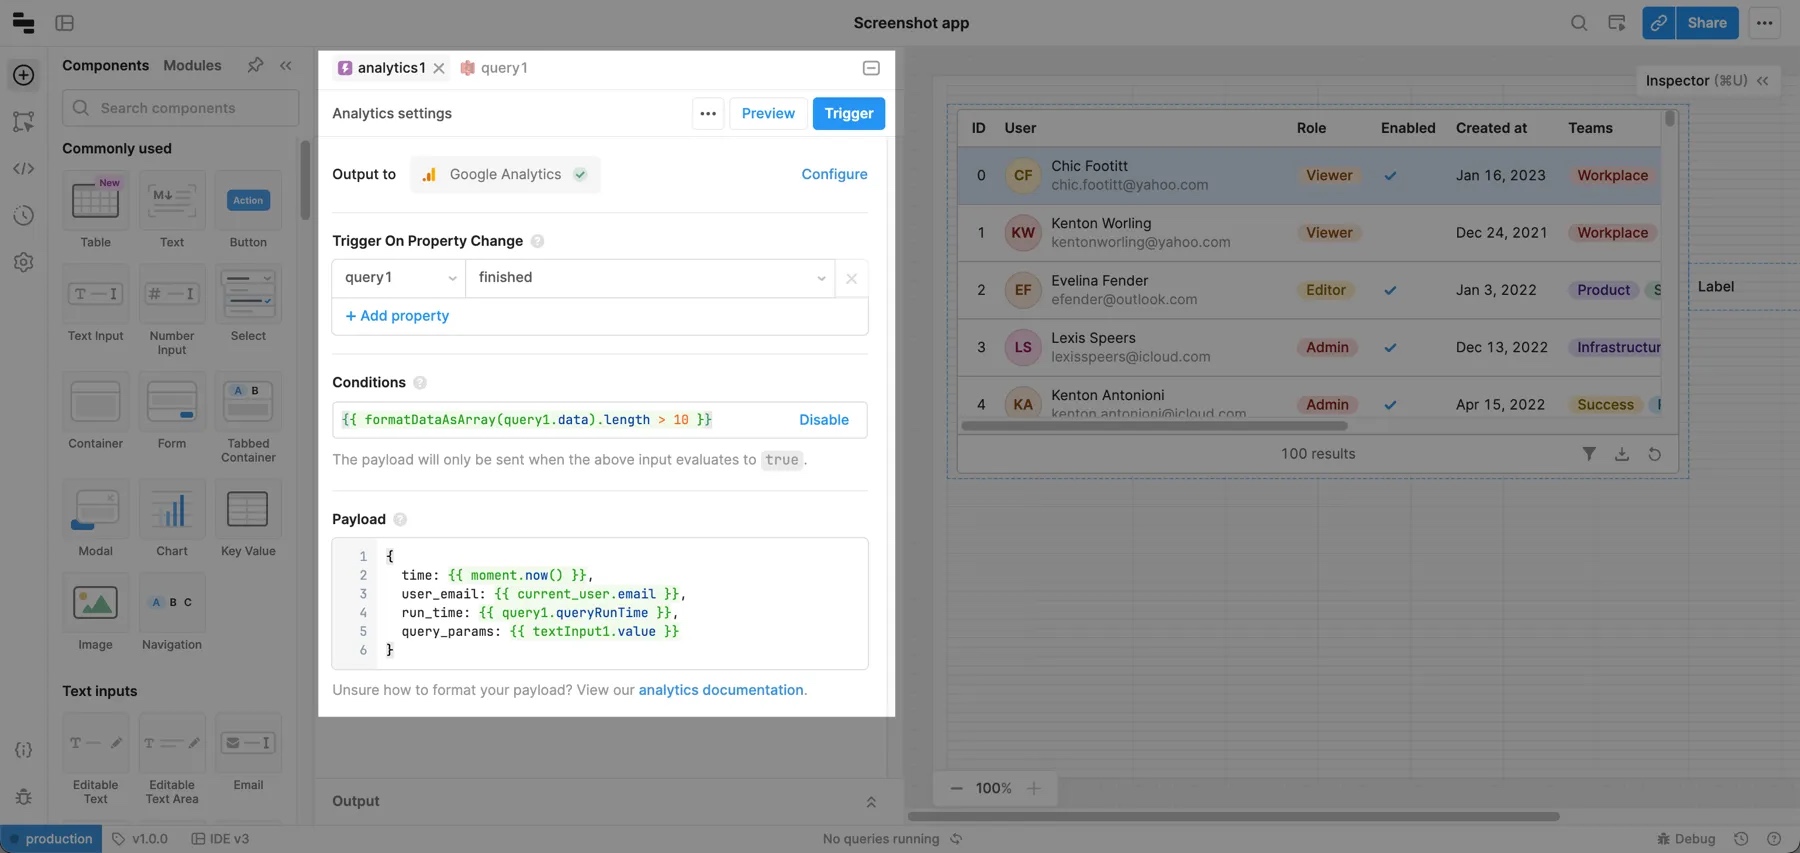
After connecting, you can create Analytics tracking queries in the app IDE.
Each analytics event has three configurable sections: when to trigger the query, what conditions have to be met, and the fields to include in the payload.
This example triggers when the finished property of query1 changes, and only runs if the query returns more than 10 items. The payload includes the current time, the user that triggered the query, how long the query took to run, and the value of the textInput1 component.
Triggering
The instrumentation event triggers when any of the listed properties change. If you want to limit when the payload is sent, enable a condition. The condition can access properties outside of your Trigger On Property Change clauses.