Generate Financial App with AppGen and Charts
Build a stock-tracking application using AppGen, add interactive charts with Retool and Plotly, and extend the app with a database write-back form.
Overview
In this lab, you will build an application to track the top 20 technology stocks using a database as the backend. This app will later be updated with charts and the ability to write back information to the database.
Data Setup
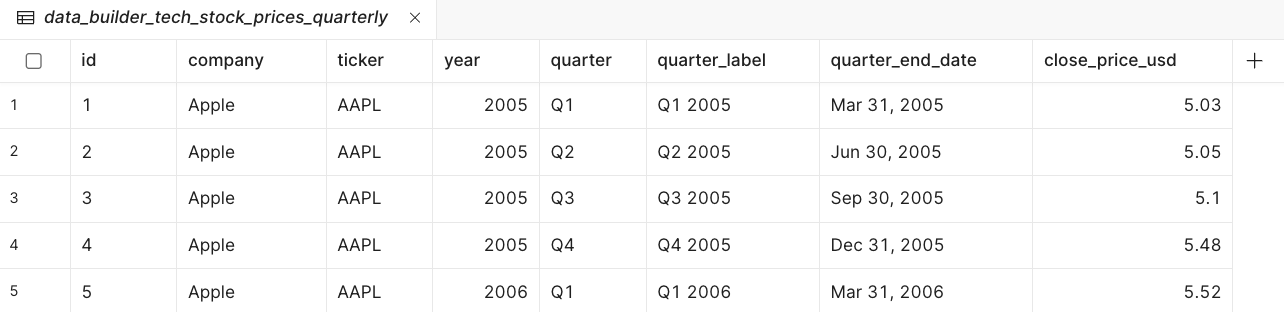
For this example, we have a CSV file that provides historical quarterly closing stock prices for the top 20 technology companies from 2005 to 2025.
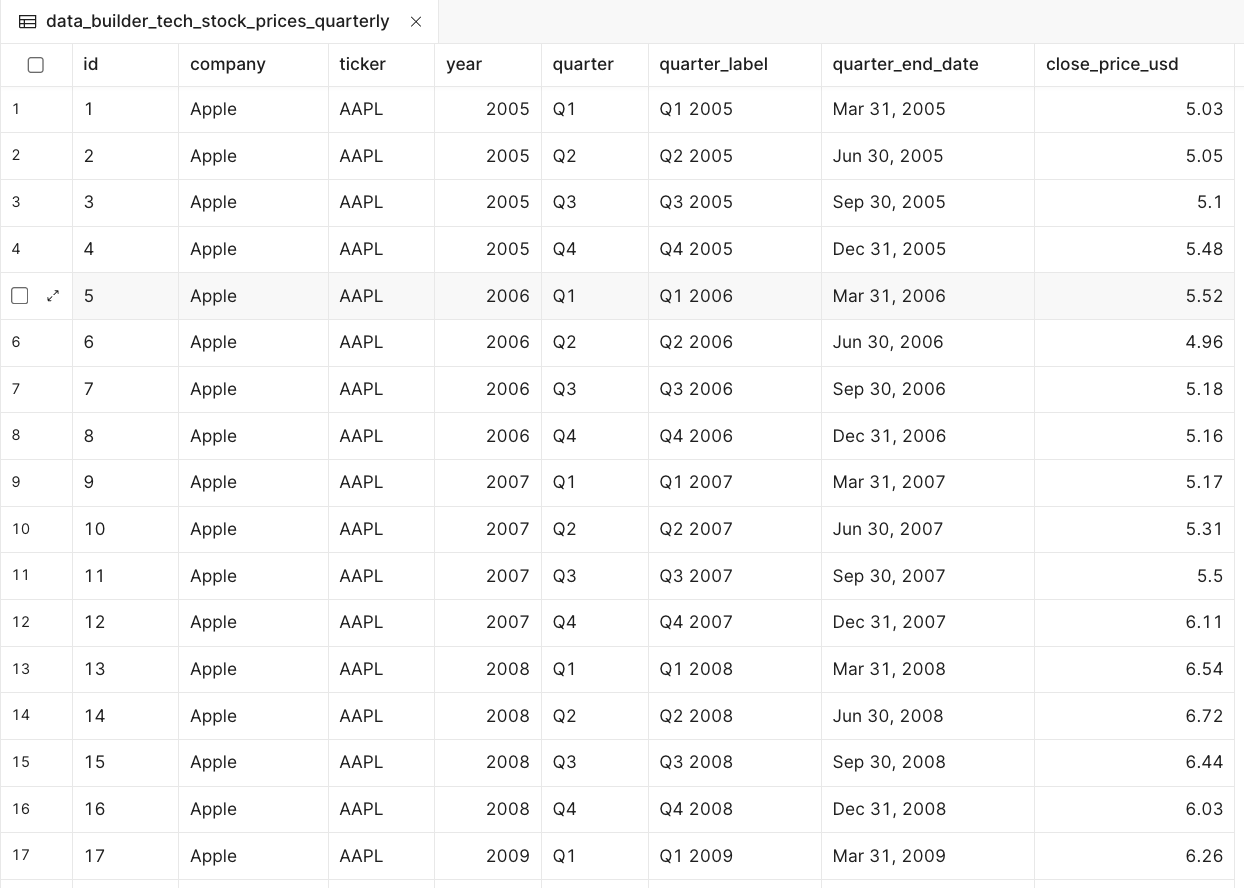
- Select Database > Import from CSV and specify a table name of
data_builder_tech_stock_prices_quarterly. - It will then appear as shown in the following image:
Create App
Next, leverage AppGen functionality available in Classic Retool or Retool to generate working applications.
Use the following prompt:
Create a historical stock-tracking application that monitors the top 20 technology companies. The data is in @Retool Database data_builder_tech_stock_prices_quarterly.
Assist
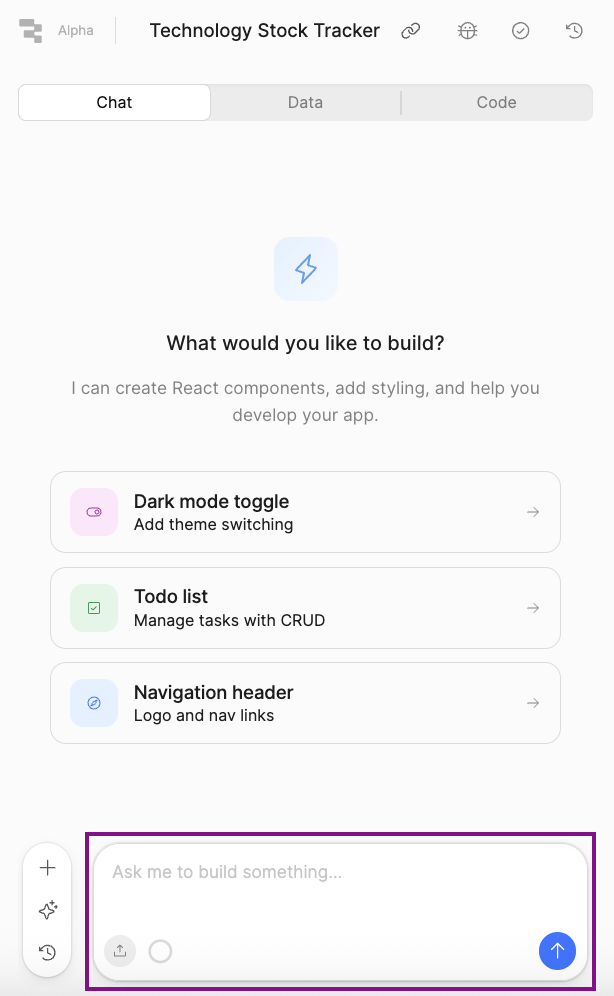
To generate a classic application using Assist, perform the following steps:
- Select Apps > Create > Classic app
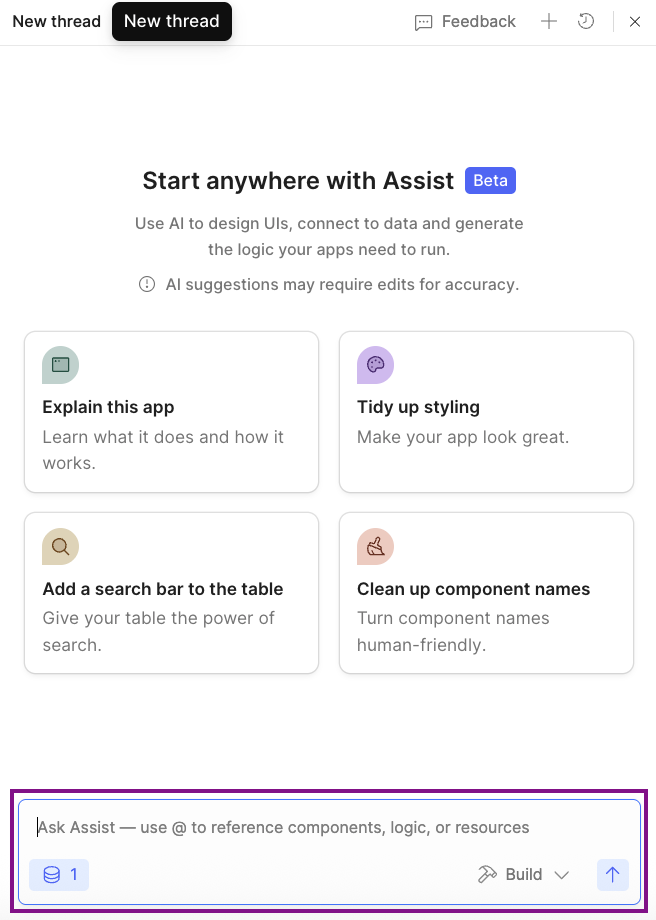
- Select the Assist icon.
- In the prompt input (highlighted in the image below), paste the previous prompt.
- Assist will start in planning mode by reviewing the identified data and the prompt details. It will return a Plan with TODOs that need to be executed. Once this is complete, the canvas will update with components and identify areas that require input, review — in essence, Human in the Loop. Examples of this include:
- Specify a Design Theme (colors, look-and-feel)
- Running Queries
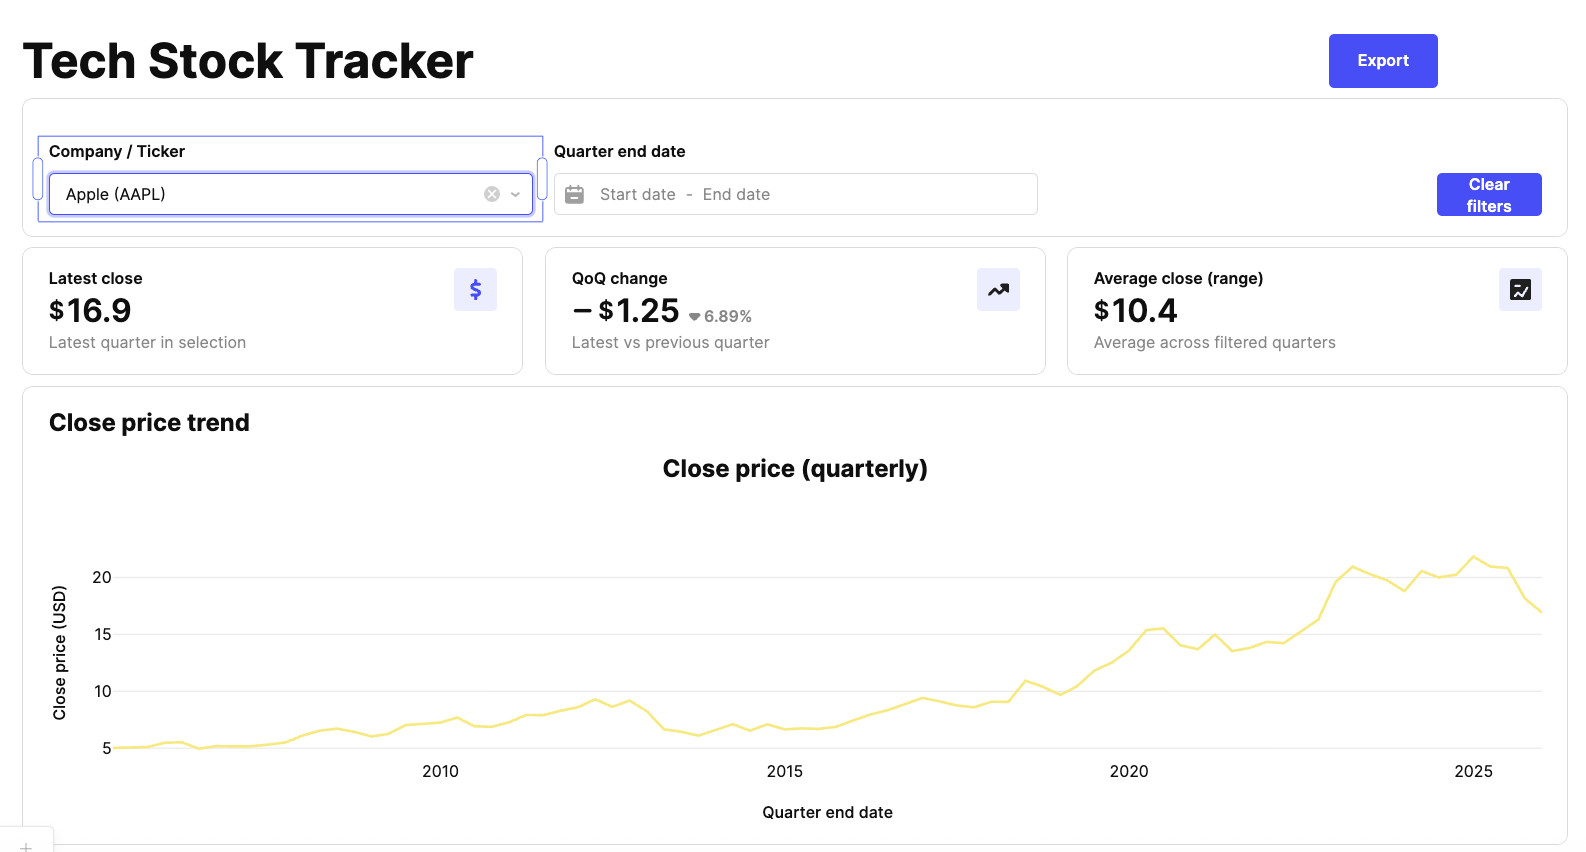
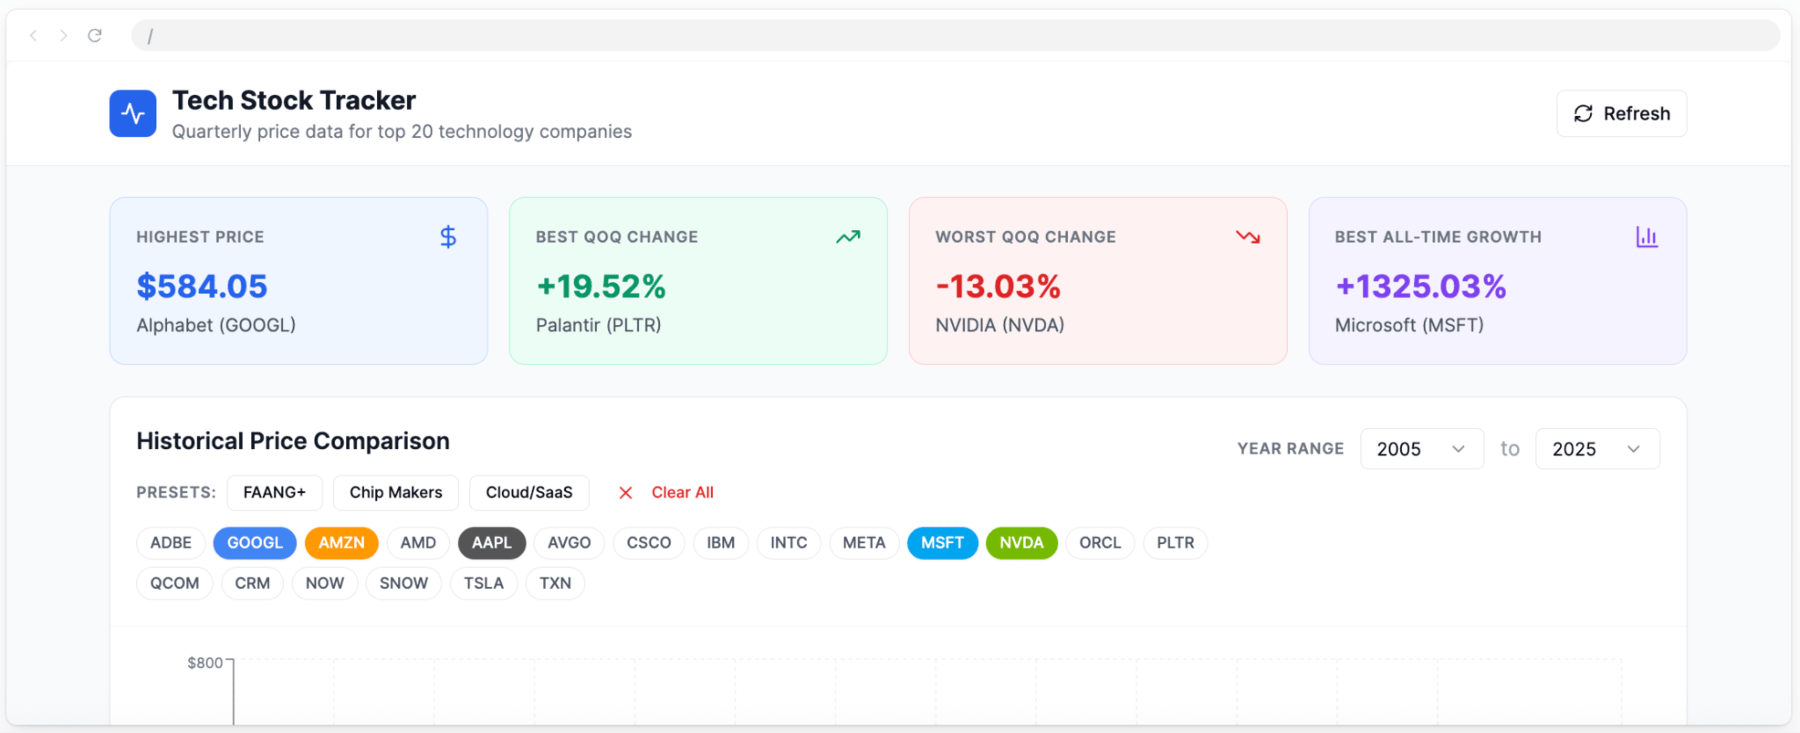
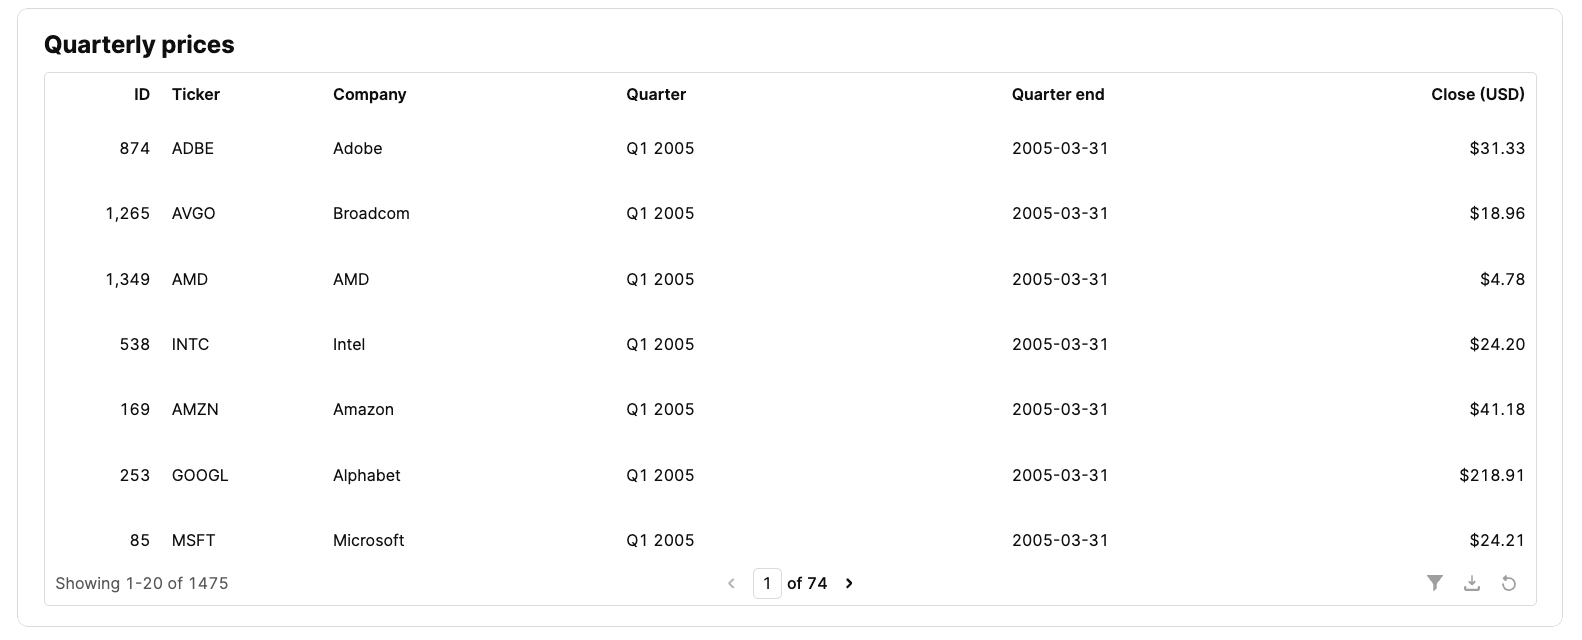
- Upon completing the list of tasks, the app will appear as shown below.
AppGen may not generate the same look and feel, but will provide the best solution based on the prompt.
Retool
To generate an application using Retool, the same prompt can be employed and entered into the prompt highlighted below.
The overall process is similar to Assist in that planning and a to-do list are executed. The result, however, will visually appear different, as this solution generates a React application defined in TypeScript and Tailwind CSS.
Add Interactive Charts
In this section, you will extend the app to include Retool Charts and Plotly.
Prompt
Use the following prompt to add a chart:
Add an additional chart that shows QoQ change for selected vendors.
Classic Retool App
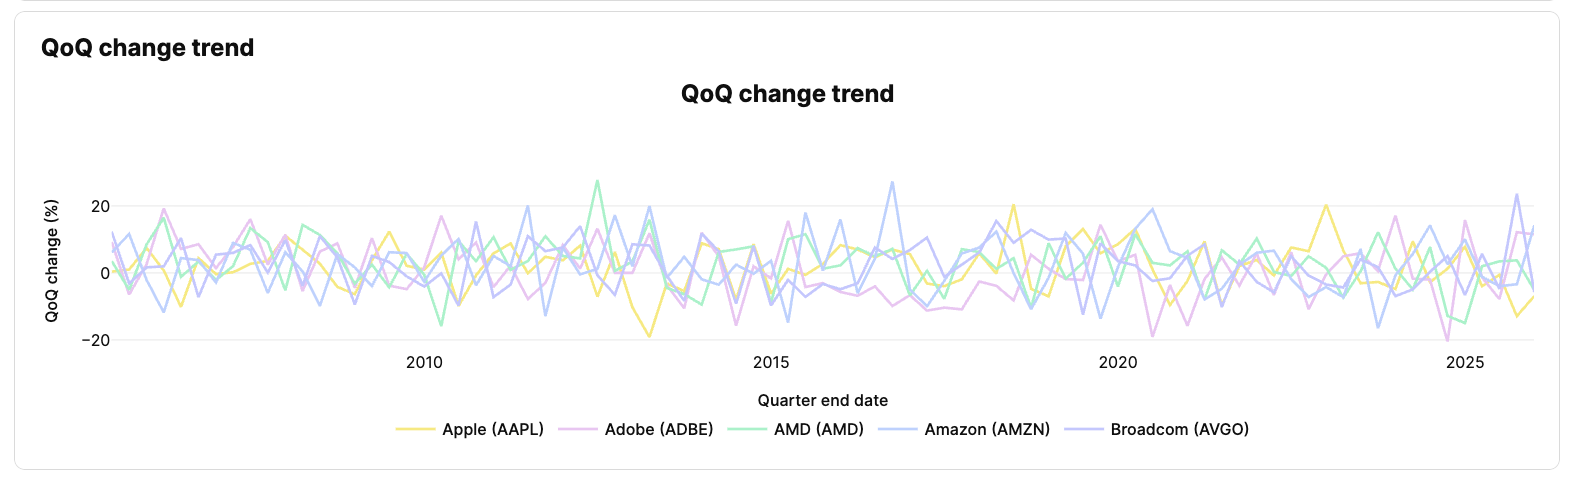
Assist generates a multi-select to allow the user to identify the vendors and the companies to compare.

Retool App
Use the same prompt above in a Retool App. The result will appear as follows:
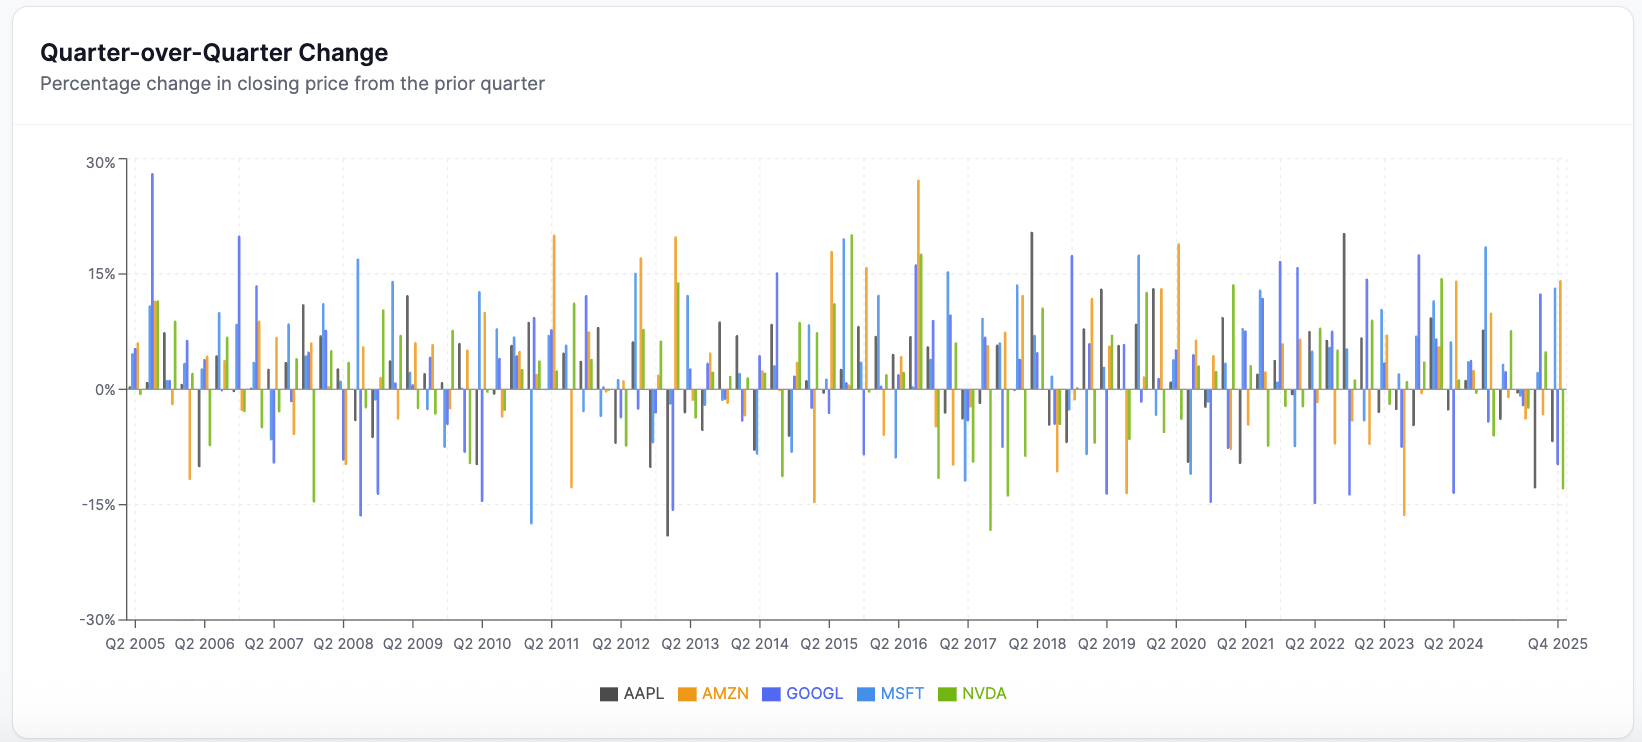
Chart Examination
Chart components with Classic Retool (Assist) focus on properties exposed via the right-panel as shown below:
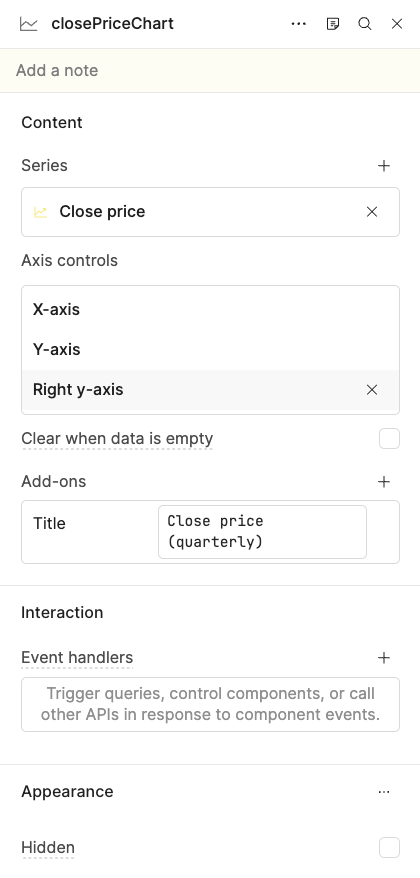
Examining the properties, Content provides the data that powers the chart. This content supports multiple datasets, referred to as Series, and you can add as many Series as you need. Axis controls provide you with control over what the X-axis, Y-axis, etc., are, as shown in the following image:
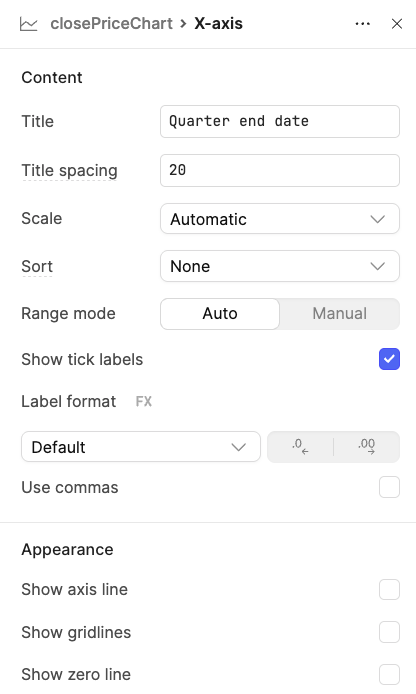
Examining this dialog, you can see the focus is on the formatting, title, spacing, and appearance of the axis. Add-ons let you add a Title, Legend, Toolbar, and Range Slider.

Plotly Charts
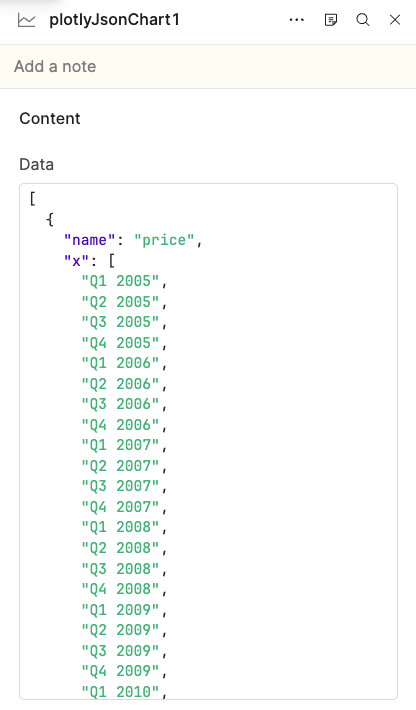
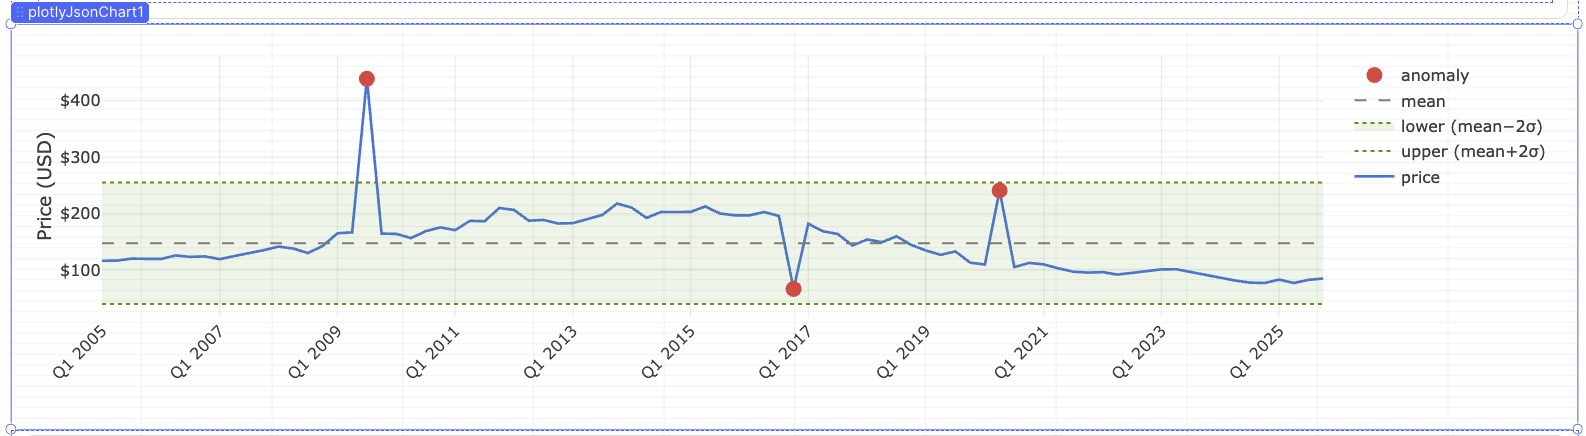
With the power of LLMs, Plotly JSON Charts have become a very quick way to ask for charts that specifically meet the need. For example, using the following prompt in an AI assistant (such as Claude):
I want you to generate a Plotly graph example that includes the JSON data and appearance details so I can update my Plotly graph component in Retool. I want to focus on anomaly detection and a dataset that, for the most part, falls within min/max ranges. At some point, the data shows two to three anomalies, as shown in the graph.
The output of this prompt included a data file and a layout file, as shown in the samples below.
- To add a Plotly chart select Add UI > + > Plotly JSON chart
- Drag and drop onto the canvas
- In the right-panel for the Plotly JSON Chart, specify a data file (example below)
Data file
- This entry would appear as shown in the following image:
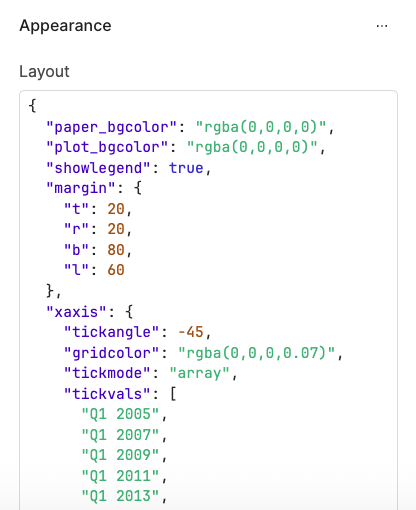
- In the right-panel for the Plotly JSON Chart, specify the layout file (example below)
Layout file
- This entry would appear as shown in the following image:
Once the data and layout are configured, the following image shows the result of the Plotly JSON Chart:
Modify Database
Let's update the Classic Retool App to include a new column called Number of Shares and enable it to capture the number of shares of a stock acquired in that quarter.
- In the
data_builder_tech_stock_prices_quarterlytable, select + to add a new column.
This will display a dialog where you can specify the column name, column type, and other details. For this example, the following image shows the populated dialog with:
- Column name = number_of_shares
- Column type = # Number
- Number type = integer
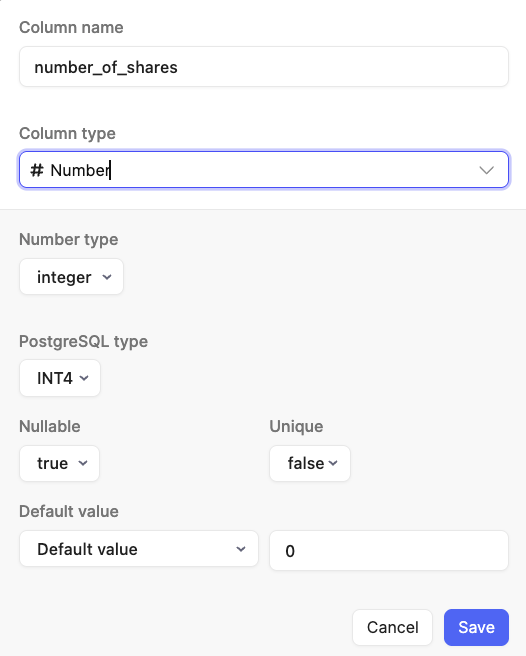
- Select Save
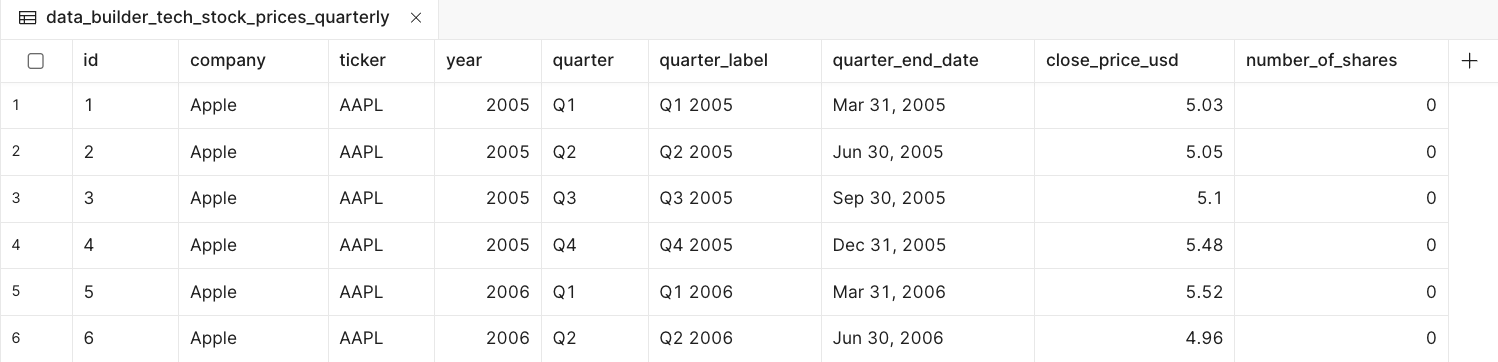
- The database table will then display the column as shown below.
Modify Classic Retool App
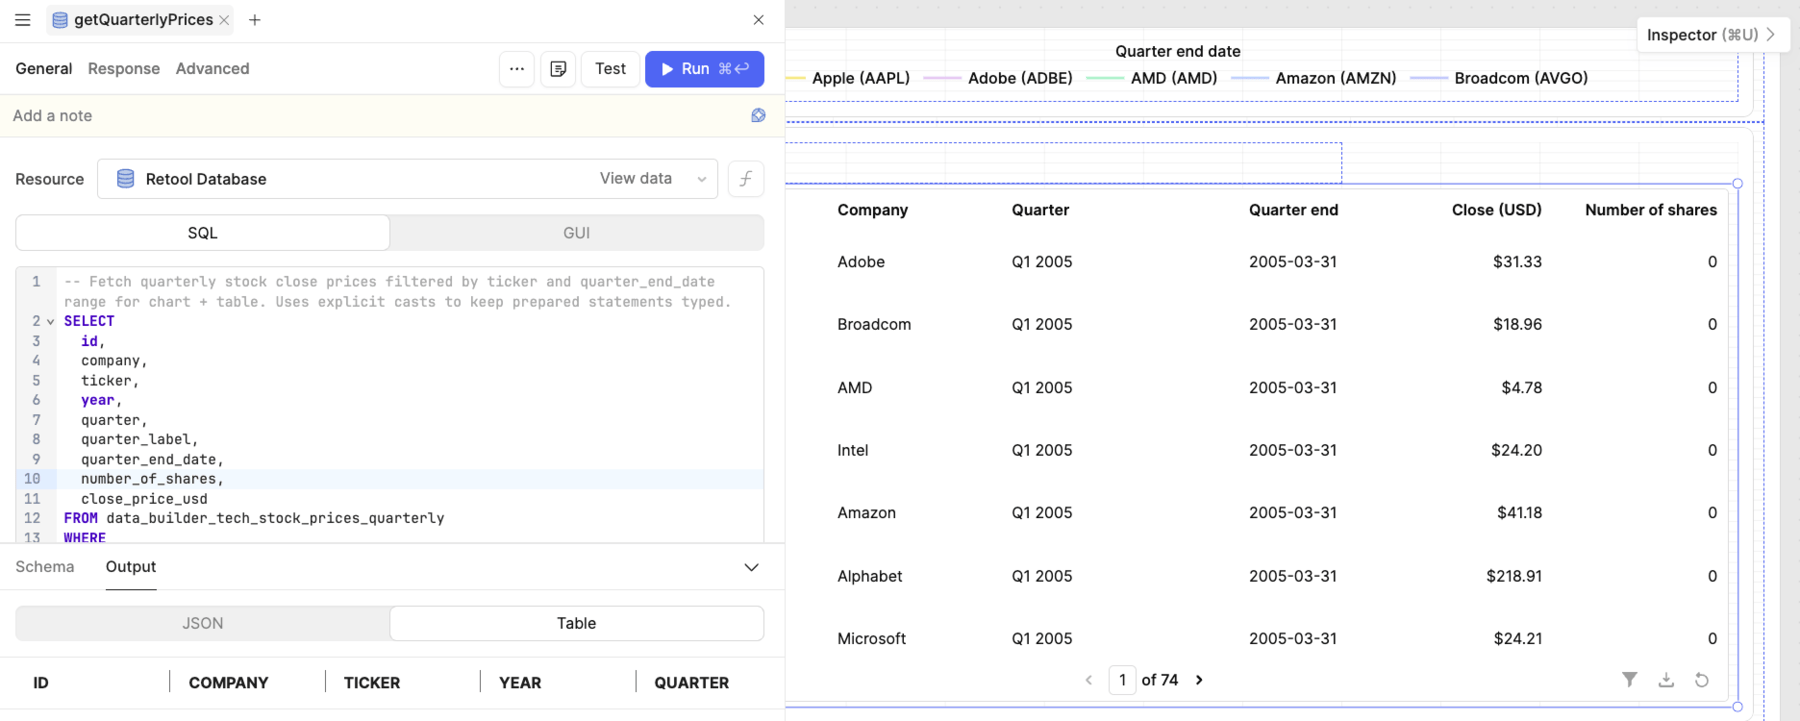
Next, we will add a column to the Retool Application. The following image shows the table prior to modification.
- Edit the application and select the table.
- Select the Code selection in the left panel. This will display in the Graph how the table is populated by the
getQuarterlyPricesquery.
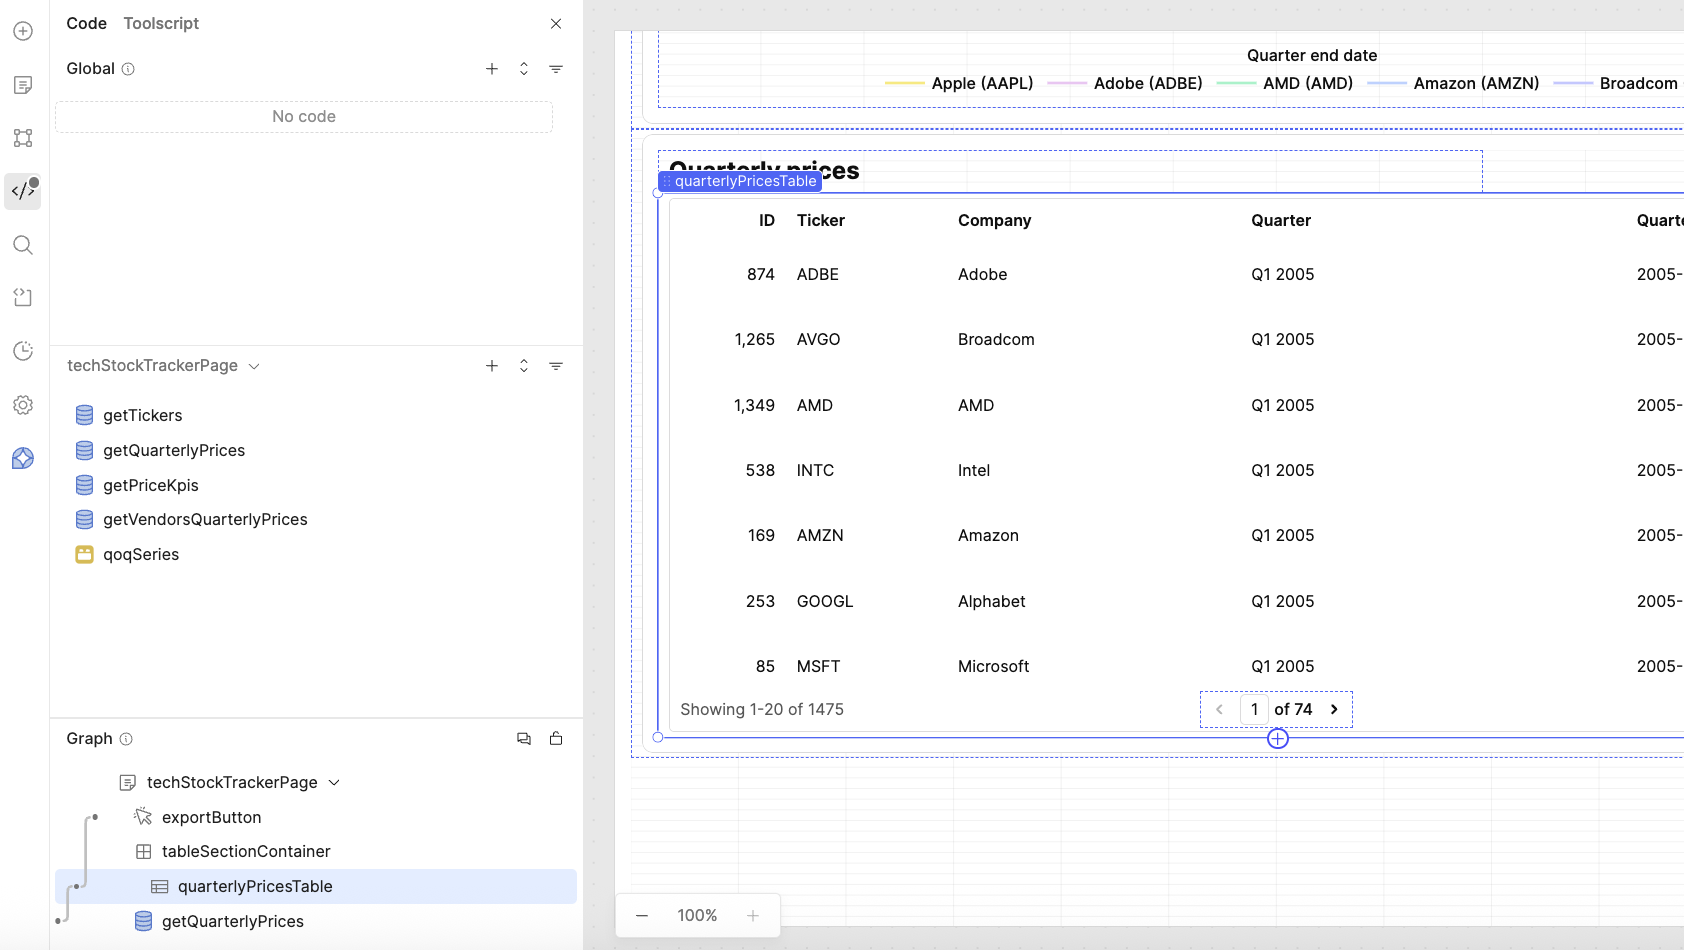
- Select the
getQuarterlyPricesquery in the page scope (e.g.,techStockTrackerPage). This will display the SELECT query.
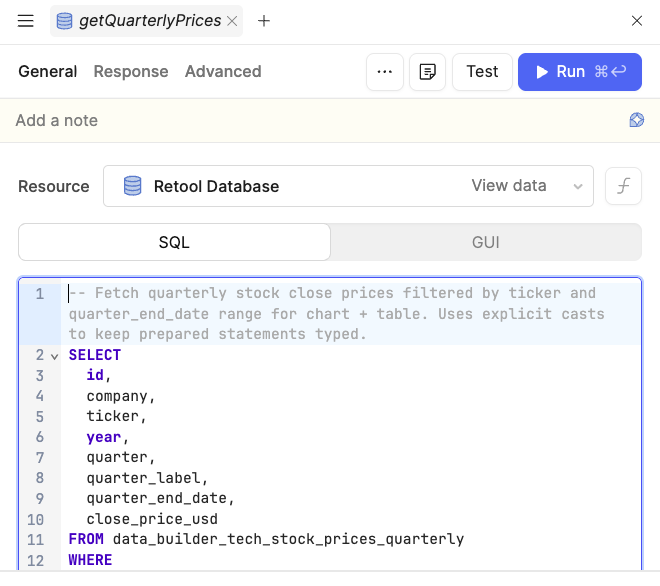
- Edit the SELECT to include the column
number_of_shares.
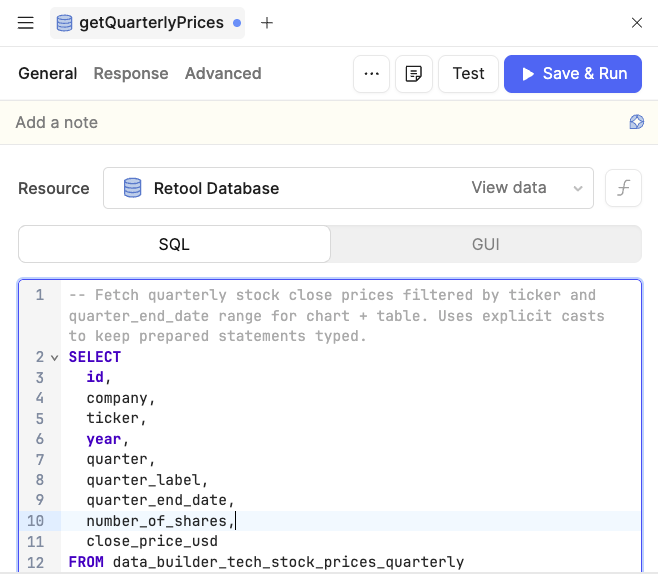
- Select Save & Run to execute the query and update the table. The following image shows the new column.
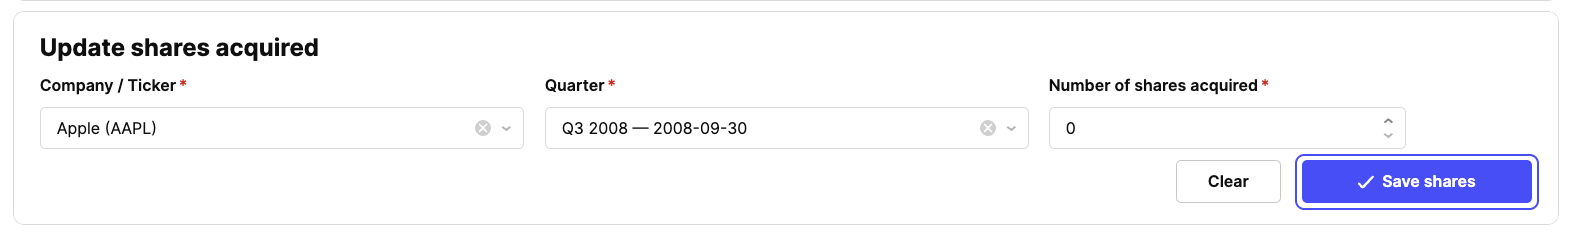
Next, we will use Assist to add a form that allows the user to specify the company, quarter, and the amount of shares acquired.
- Select Assist to access the panel.
- Enter the following prompt:
I want a form that lets me specify the number of shares acquired by a company during a quarter. The form will update @Retool Database data_builder_tech_stock_prices_quarterly and specifically the number_of_shares column.
The following form was created with a populated list of companies, quarters, and a Number of shares acquired field.
What is generated when using Assist can be different, but should provide similar functionality.
This prompt generated a query called updateQuarterShares that looks like the following:
-- Update number_of_shares for a specific quarterly price row (by id).
UPDATE data_builder_tech_stock_prices_quarterly
SET number_of_shares = {{ sharesAcquiredForm.data.number_of_shares }}
WHERE id = {{ sharesAcquiredForm.data.price_id }}
RETURNING id, ticker, quarter_label, quarter_end_date, number_of_shares;
This query is executed when the Save shares button is selected, triggering an event handler. The selected components are populated by additional queries, such as getTickers and getQuartersForTicker. The getTickers query is shown below, and this is used to populate the select.
-- Fetch distinct tickers/companies to populate the Company/Ticker filter.
-- Limited to 20 tech companies (top 20 by presence in dataset).
SELECT
  ticker,
  MAX(company) AS company
FROM data_builder_tech_stock_prices_quarterly
WHERE ticker IS NOT NULL
GROUP BY ticker
ORDER BY ticker
LIMIT 20;
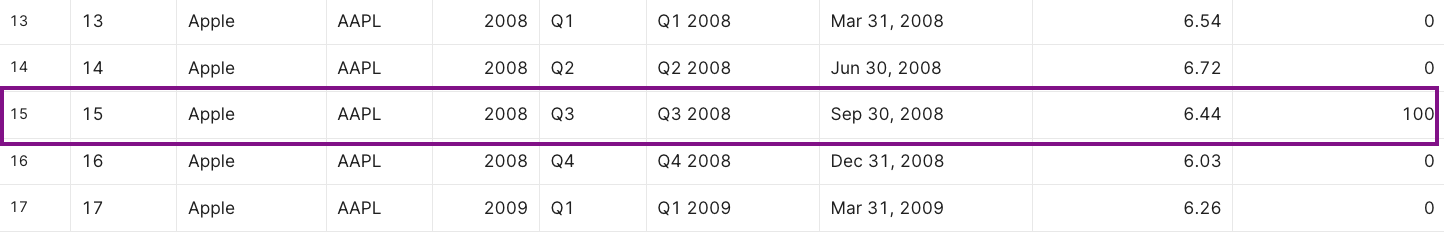
When we test the form by selecting Apple, Q3 2008, and 100 shares, we see the result in the Retool Database table.