Query Library and Chart Development
Use Retool Query Library to create shareable queries and build a bar chart that visualizes historical stock price data for multiple companies.
Overview
In this lab, you leverage Retool Query Library to create two shareable queries that you can employ in developing a Retool Chart.
Prerequisite
This lab requires that you have administrative control to be able to add a table to Retool Database.
Data Setup
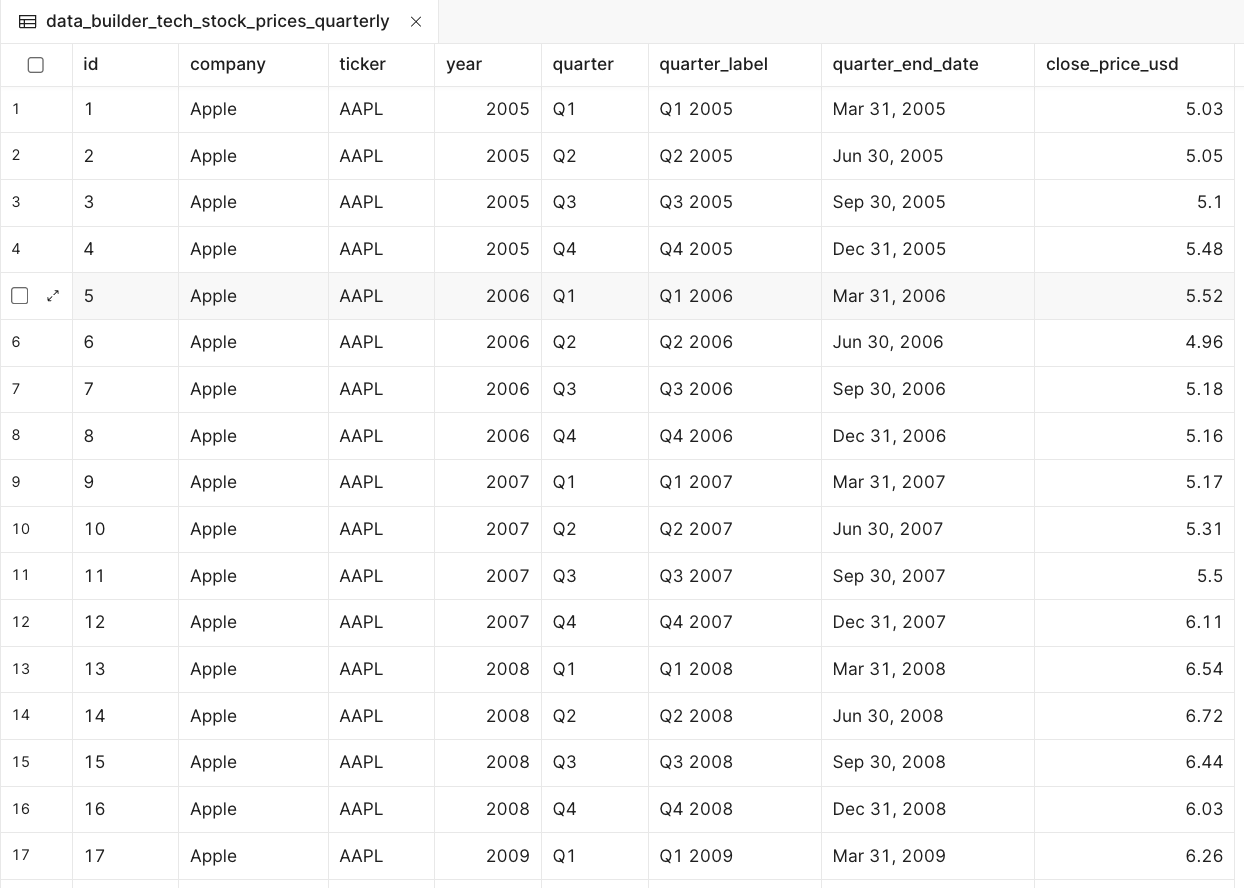
For this example, you have a CSV file that provides historical quarterly closing stock prices for the top 20 technology companies from 2005 to 2025.
- Select Database > Import from CSV and specify a table name of
data_builder_tech_stock_prices_quarterly.
Once imported, the table will appear as shown in the following image:
Create Queries in Query Library
Retool provides a query development environment focused on shareable queries that can be used across the Retool platform.
AAPL Query
- To develop shareable queries, select Retool Home > Query Library > New. This will display the following dialog:
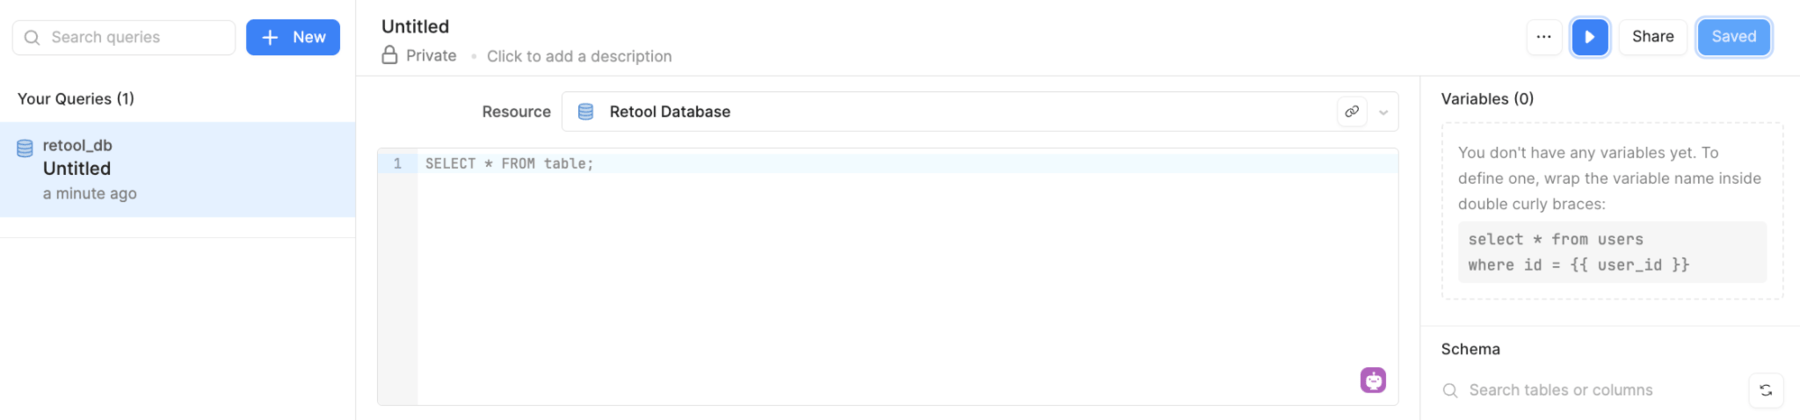
- Update the name Untitled to
tickerDetailsAAPL - Make sure Resource is set to Retool Database
- Enter the following query:
SELECT * FROM data_builder_tech_stock_prices_quarterly WHERE company LIKE '%Apple%'
- Run the query. It should now appear as shown in the following image:
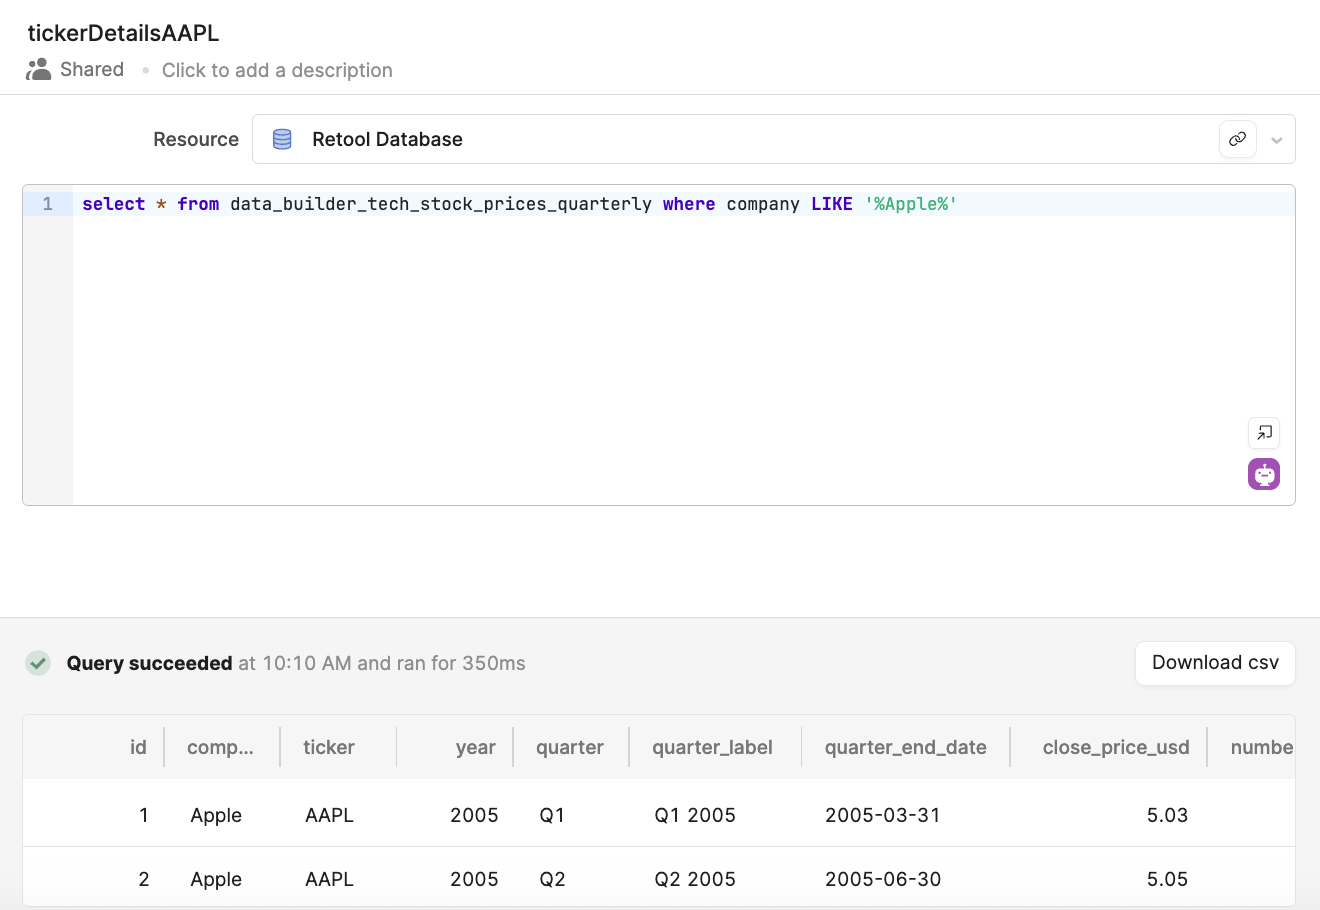
- Next, select Save, then select Share in the upper-right corner of the Query Library. This will make it accessible to anyone with the current Retool Space so that you can select it in your app.
TSLA Query
- Repeat the process by creating a new query called
tickerDetailsTSLAand use the following query:
SELECT * FROM data_builder_tech_stock_prices_quarterly WHERE company LIKE '%Tesla%'
- Save and share the query.
Create an App with a Bar Chart
Import Queries
Next, you will create a Retool App and manually add a chart to the canvas.
- Select Retool Home > Apps > Create > App
- Rename the app to
Chart-example
Before you can create a chart, import the queries you built in Query Library into the application.
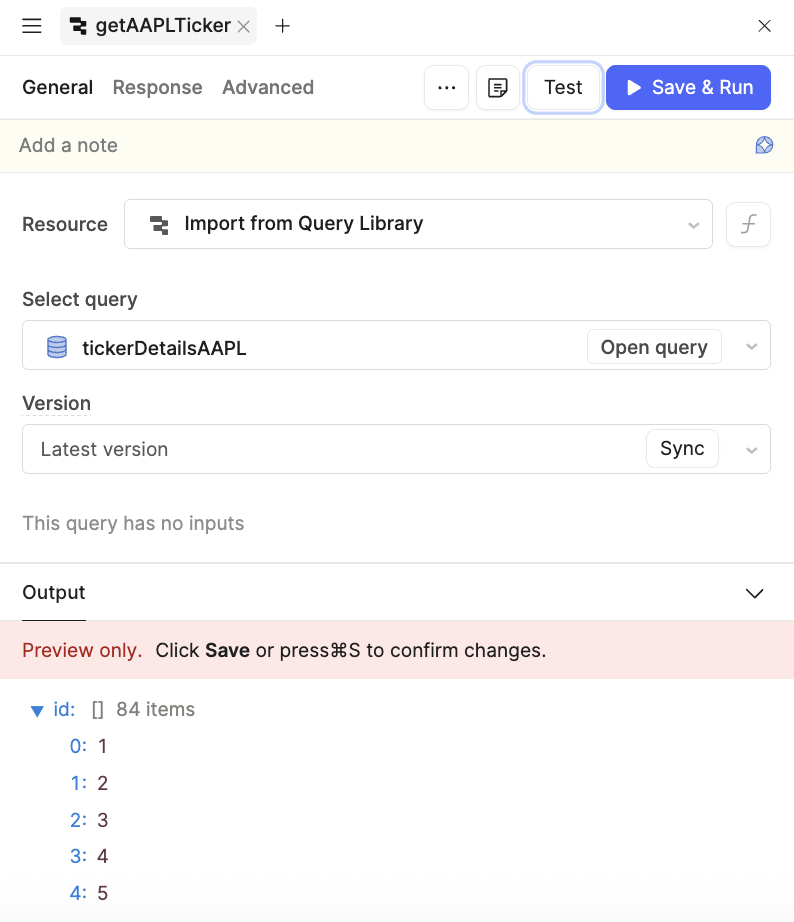
- Select Code > Import query from library
- Update the name to
getAAPLTicker - Set Select query to
tickerDetailsAAPL - Make sure Version is set to Latest version
- Select Save & Run to save the configuration.
You will repeat this process for tickerDetailsTSLA.
- Select Code > Import query from library
- Update the name to
getTSLATicker - Set Select query to
tickerDetailsTSLA - Make sure Version is set to Latest version
- Select Save & Run to save the configuration.
Add a Bar Chart
Next, a bar chart will be added to the canvas and configured to use two data sets.
- Select (+) Add UI > Chart > Bar chart
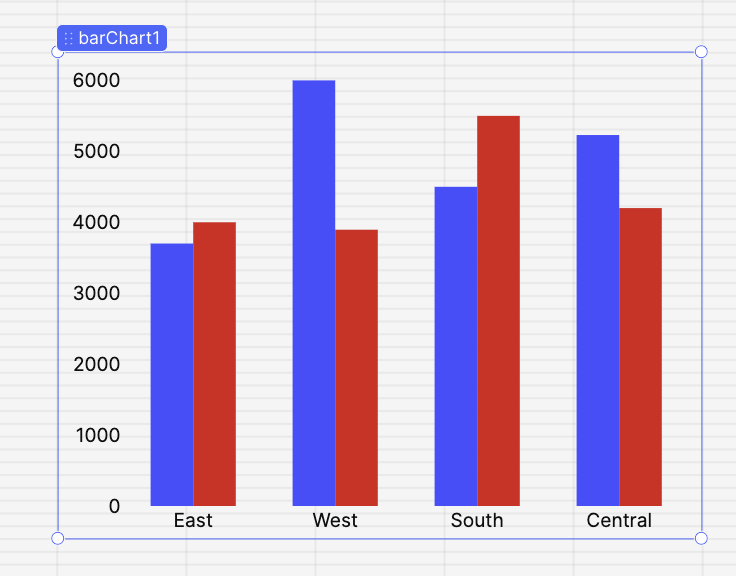
This adds a chart with mock data as shown below:
- Next, configure the bar chart to use your data. Select the bar chart so that
barChart1is displayed. In the right-hand panel (Inspector), the chart configuration will appear:
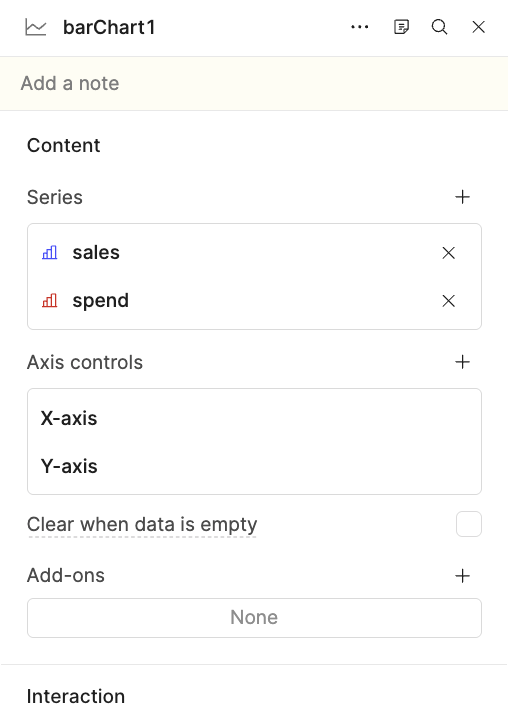
- Delete the two default series, sales and spend.
- The two queries you developed will be added as individual series under Content.
- Select Series > +
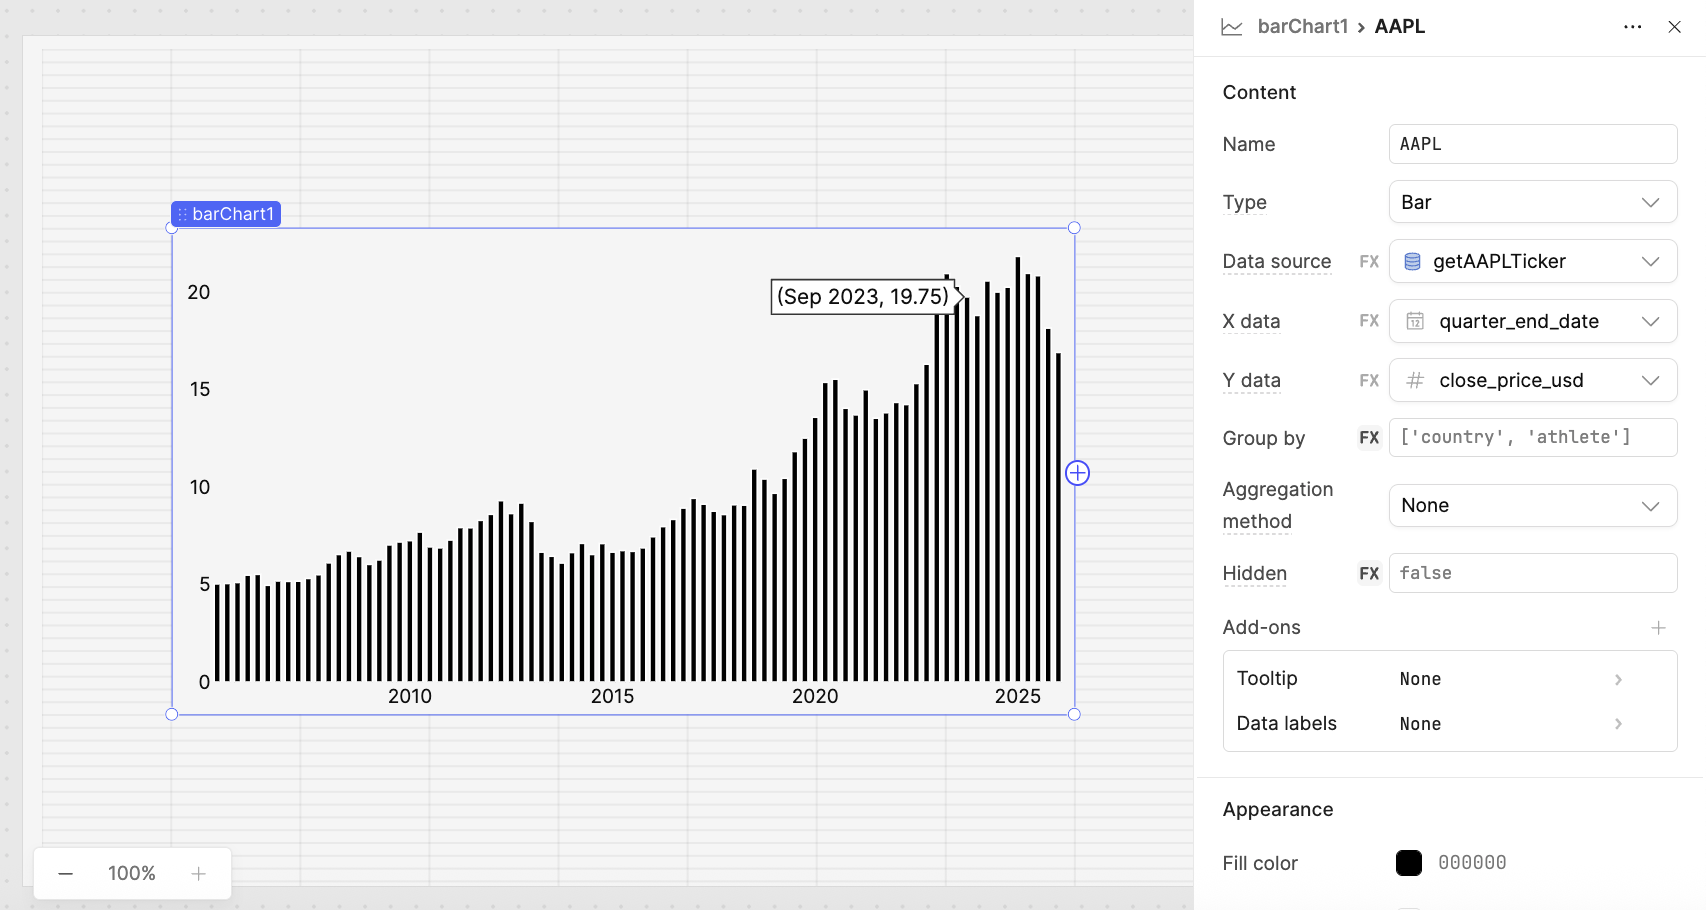
The following image shows a completed configuration for the AAPL series:
- Name =
AAPL - Type =
Bar - Data source =
getAAPLTicker - X data =
quarter_end_date - Y data =
close_price_usd
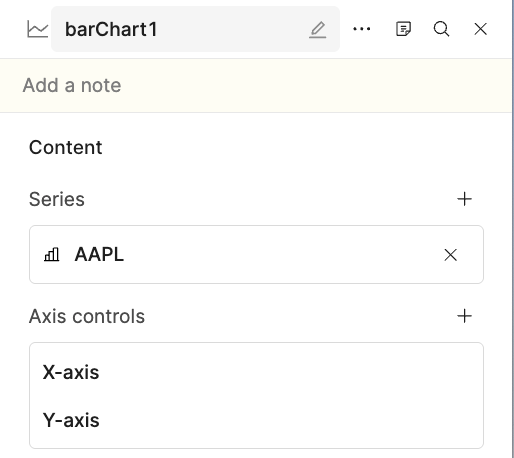
- Once complete, select barChart1 to return to the series display and confirm that the AAPL series is displayed:
- Next, repeat the process and add another series for the TSLA query. Select Series > +
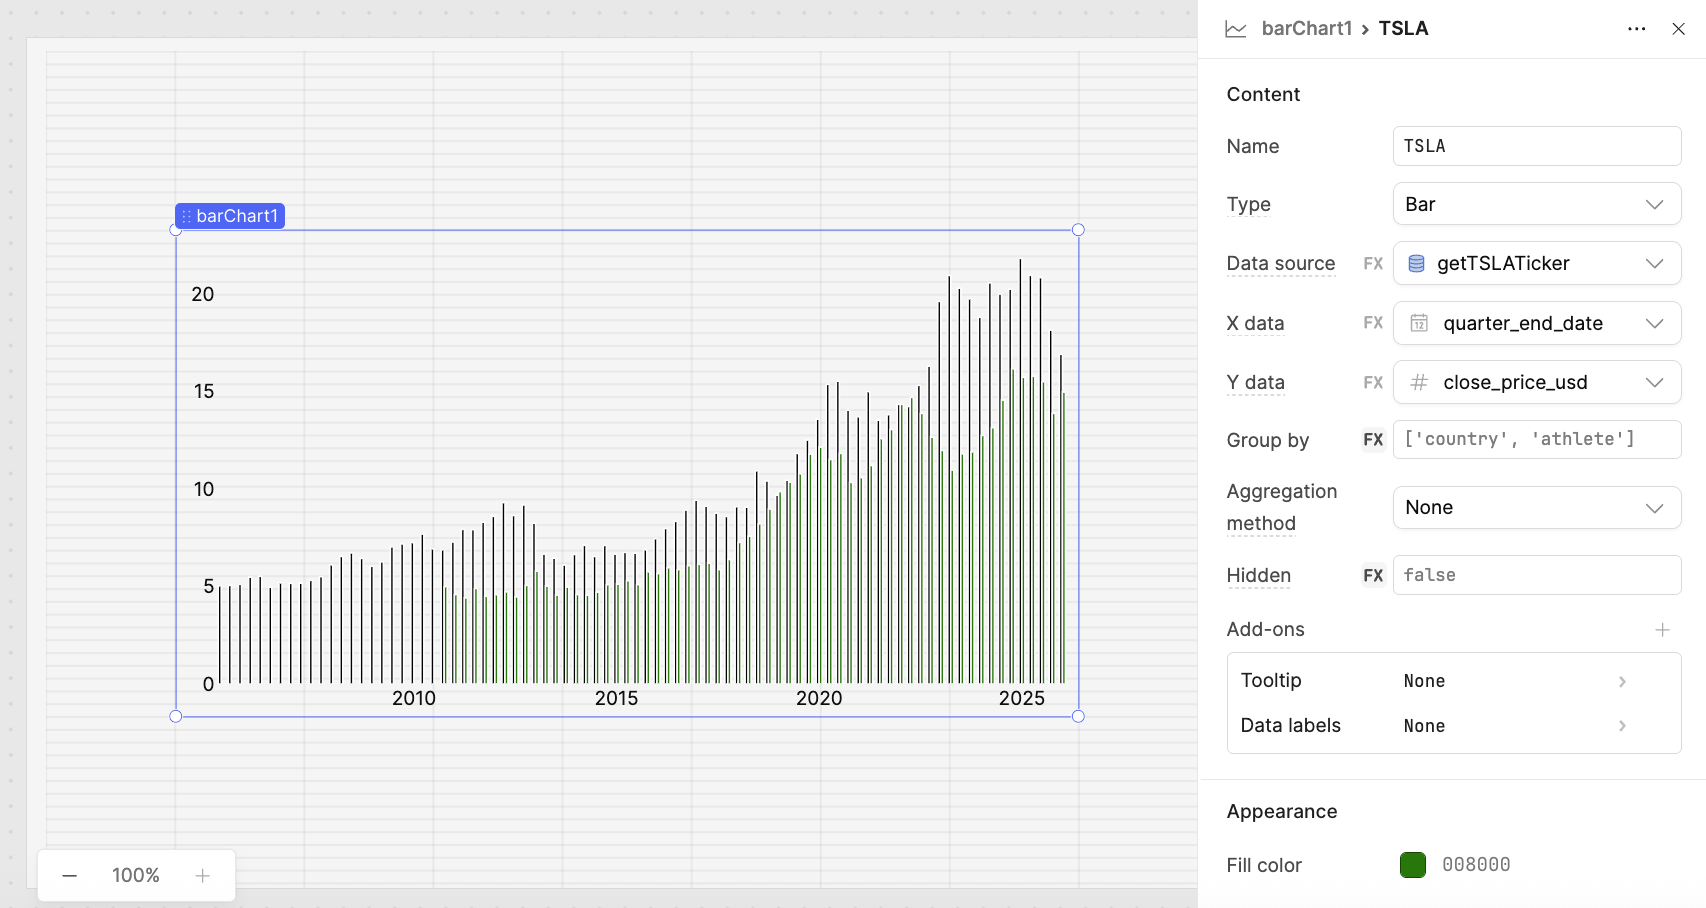
The following image shows a completed configuration for the TSLA series:
- Name =
TSLA - Type =
Bar - Data source =
getTSLATicker - X data =
quarter_end_date - Y data =
close_price_usd - Appearance > Fill color =
#008000
Configure the Bar Chart
With the base bar chart containing two series, you can further configure it to annotate the chart.
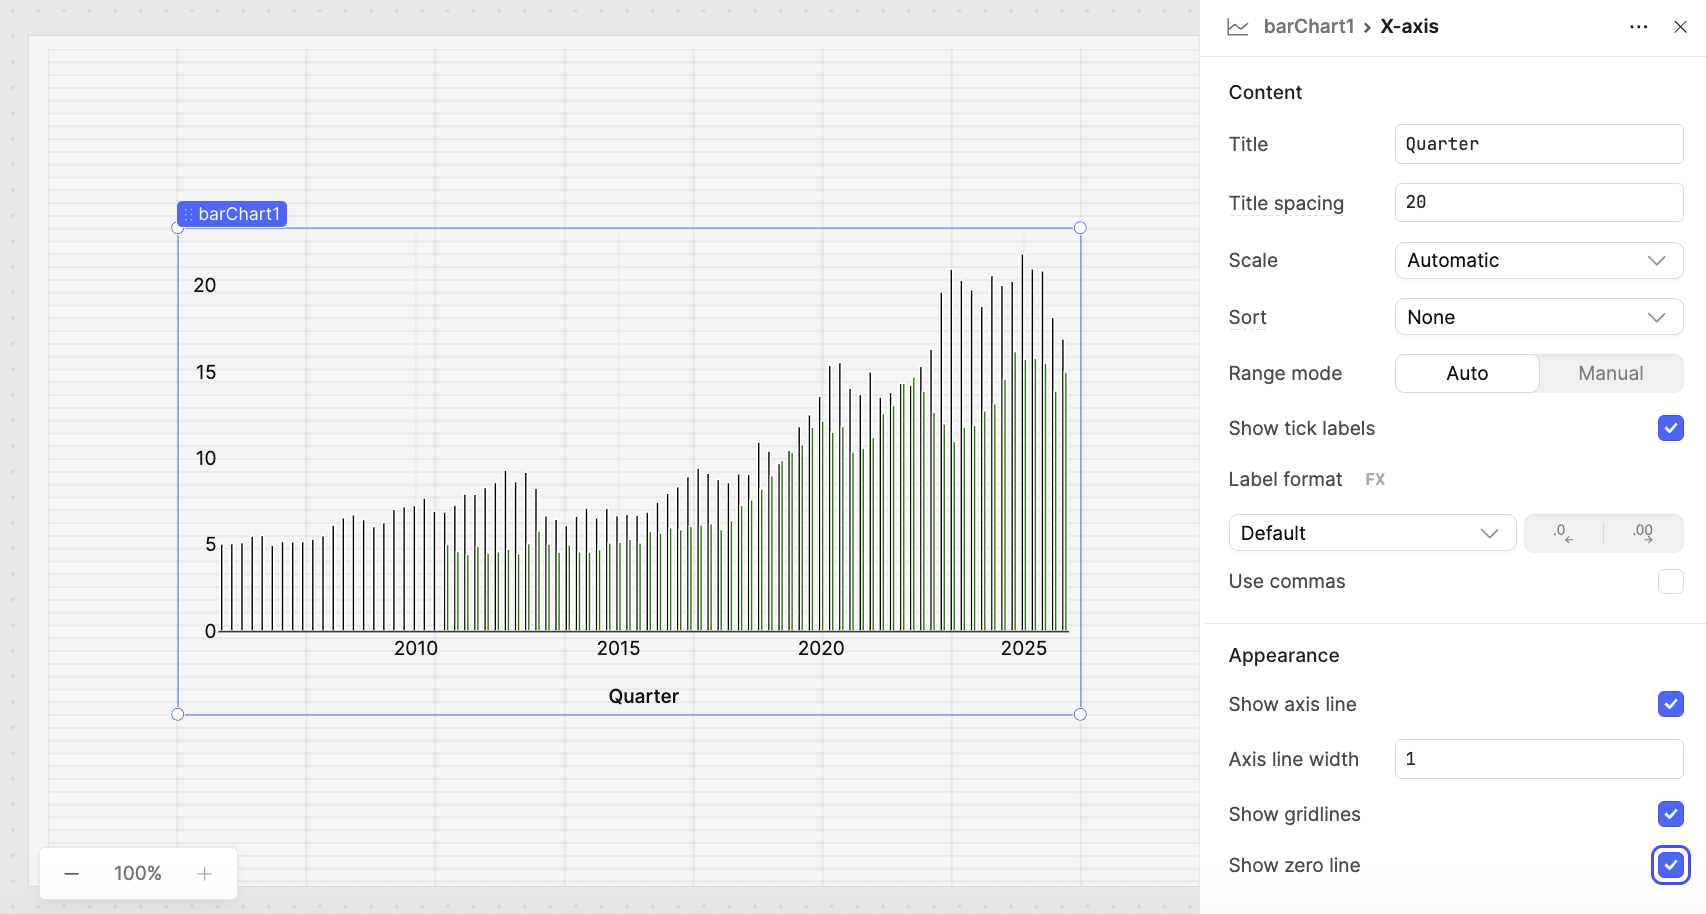
- Select barChart1 > X-axis > Content to access the X-axis details.
The following image shows a completed configuration:
- Title =
Quarter - Show axis line = On
- Axis line width =
1 - Show gridlines = On
- Show zero line = On
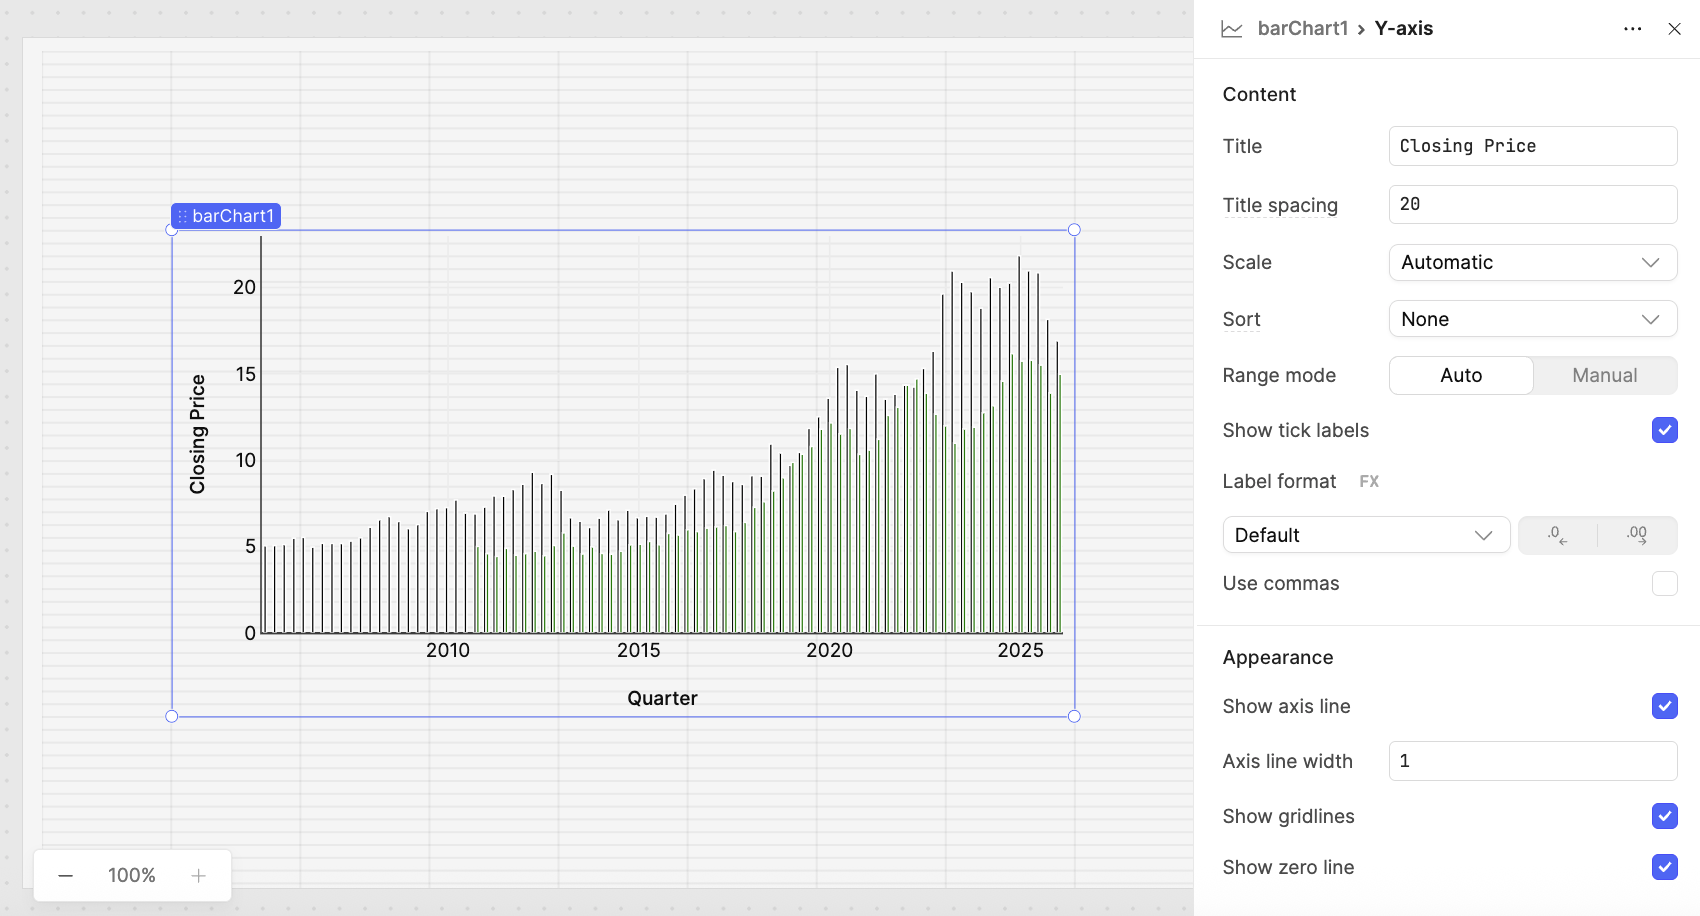
- Select barChart1 > Y-axis > Content to access the Y-axis details.
The following image shows a completed configuration:
- Title =
Closing Price - Show axis line = On
- Axis line width =
1 - Show gridlines = On
- Show zero line = On
- The last step is to add a Title and Legend. Select barChart1 > Add-ons and select Title and provide a name of
Quarterly Pricingand Legend:
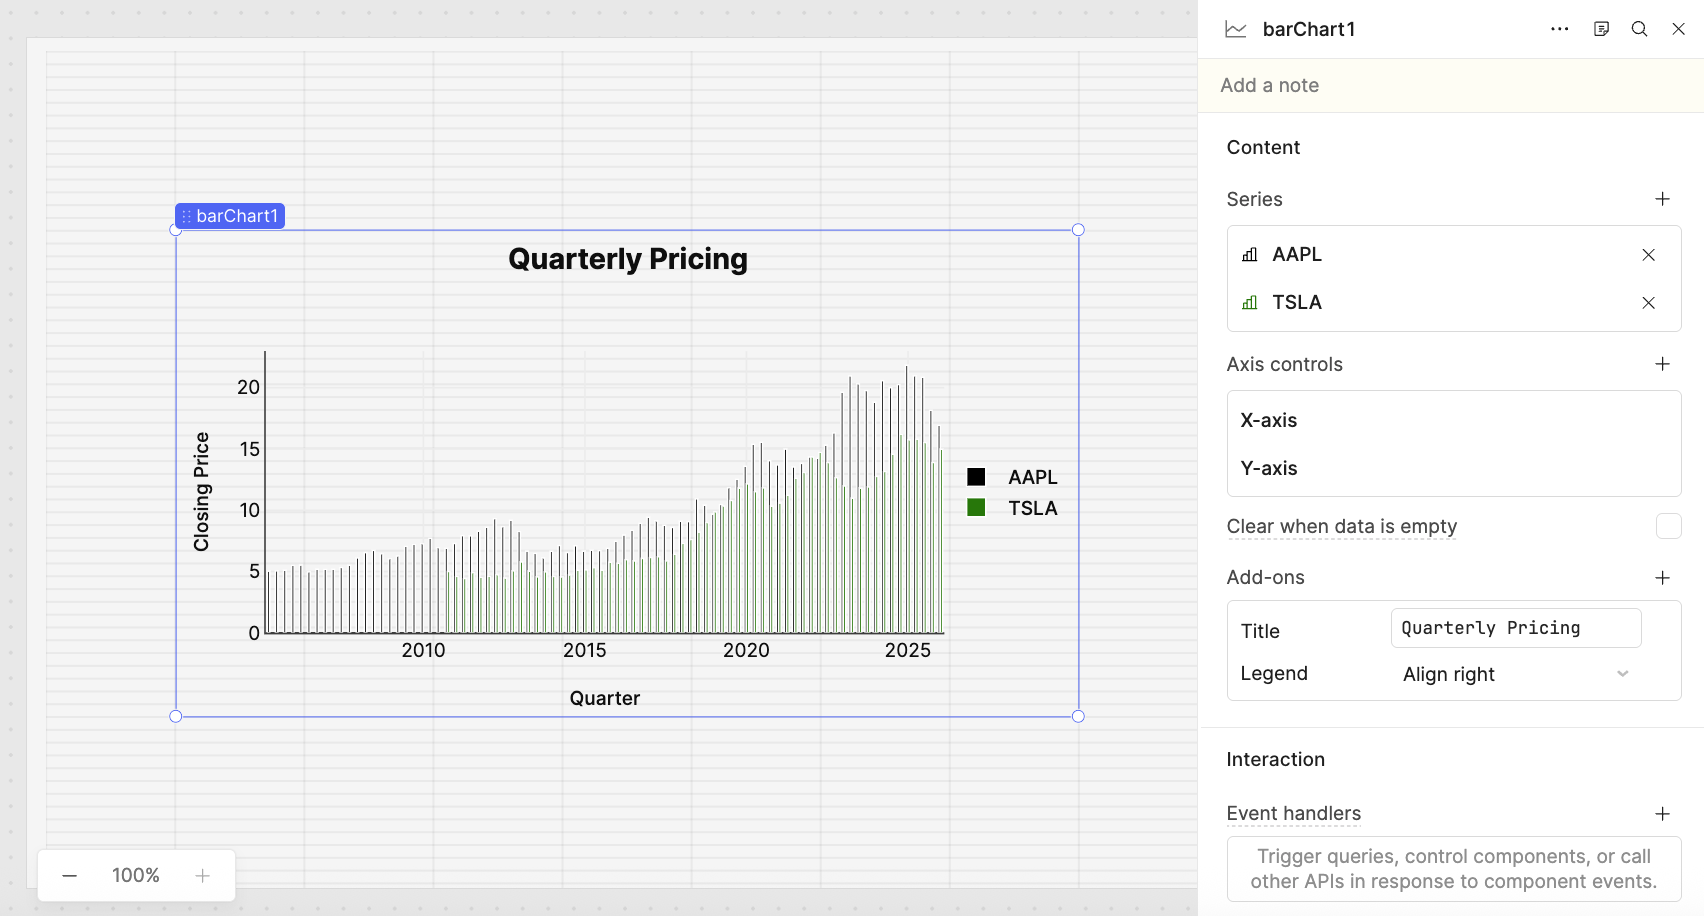
You have now completed a basic bar chart with annotations and two series of data.
Summary
In this lab, you used Retool Query Library to build and share two reusable SQL queries targeting historical stock price data for Apple and Tesla. You then created a Retool App, imported those library queries, and built a bar chart with dual series, configuring the X-axis, Y-axis, title, and legend to produce an annotated, publication-ready visualization.