Chart development in Classic App
Build a stock-tracking application via drag-and-drop and add interactive charts with Retool chart components.
Overview
In this lab, you will build an application to track the top 20 technology stocks using a database as the backend. This app will later be updated with charts.
Data Setup
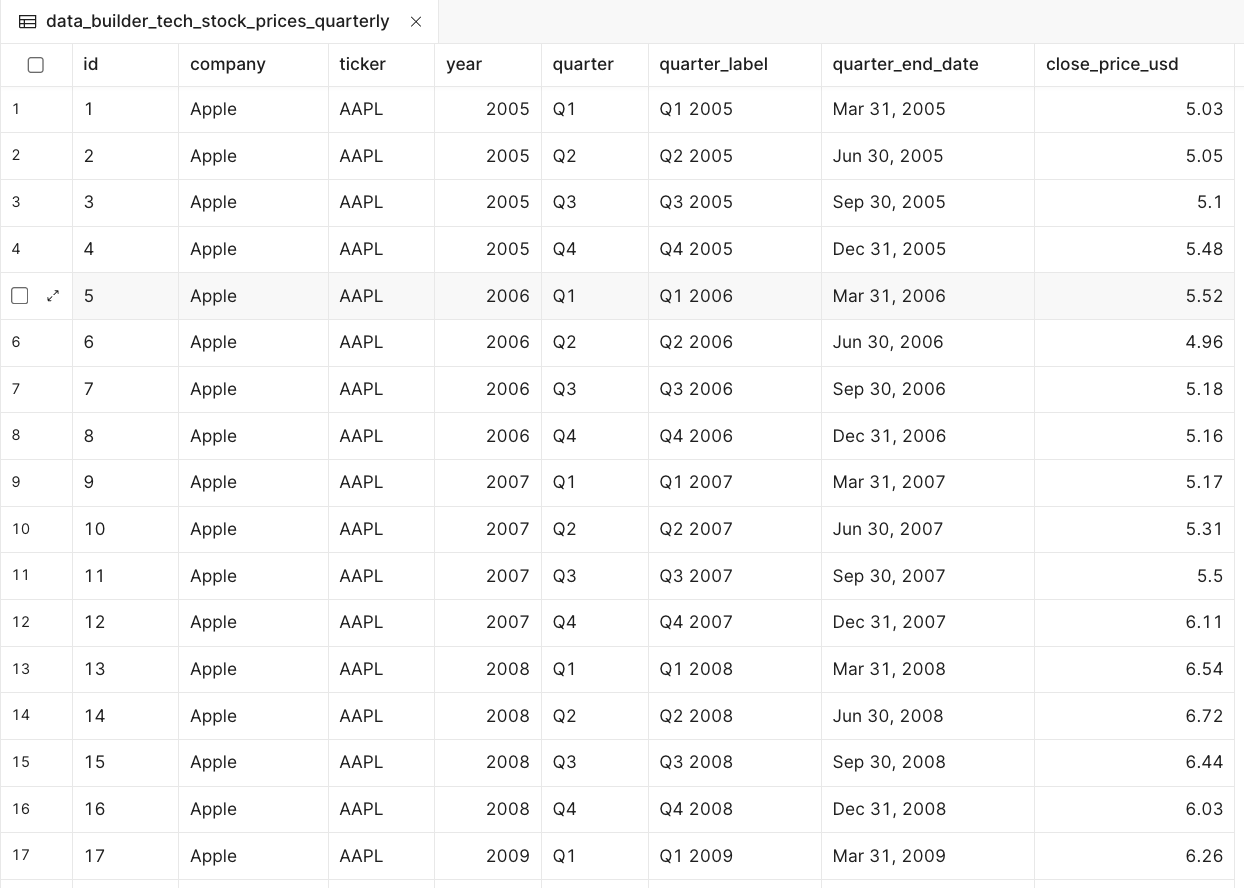
For this example, we have a CSV file that provides historical quarterly closing stock prices for the top 20 technology companies from 2005 to 2025.
- Select Database > Import from CSV and specify a table name of
data_builder_tech_stock_prices_quarterly. - It will then appear as shown in the following image:
Create App
Now that the data is ready, we will create a basic classic application.
- Select Apps > Create > Classic app
This will then load the Classic app editor. We will first create a query to pull in data from Retool Database.
Create query
Queries are how Retool pulls data into an application. Let's create a query to pull in the full table.
- Select Code > page1 > + > Resource query
- Query name =
getStocks - Resource =
Retool Database - SQL:
- Query name =
select * from data_builder_tech_stock_prices_quarterly
- Select Save & Run
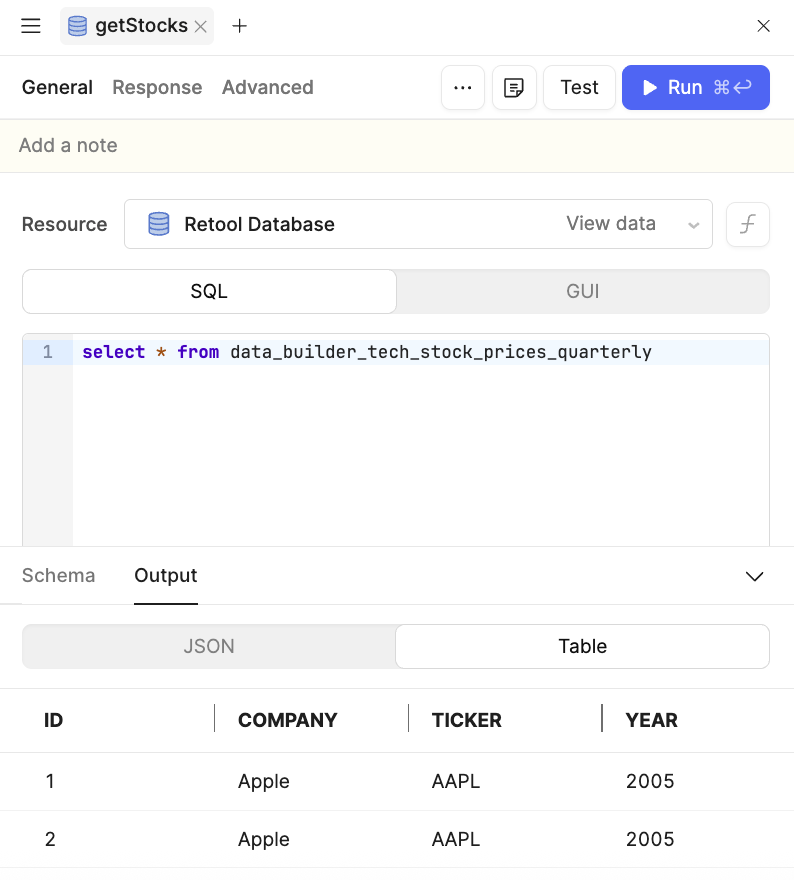
- Confirm in the Output tab in the Query editor that data displays.
Create table
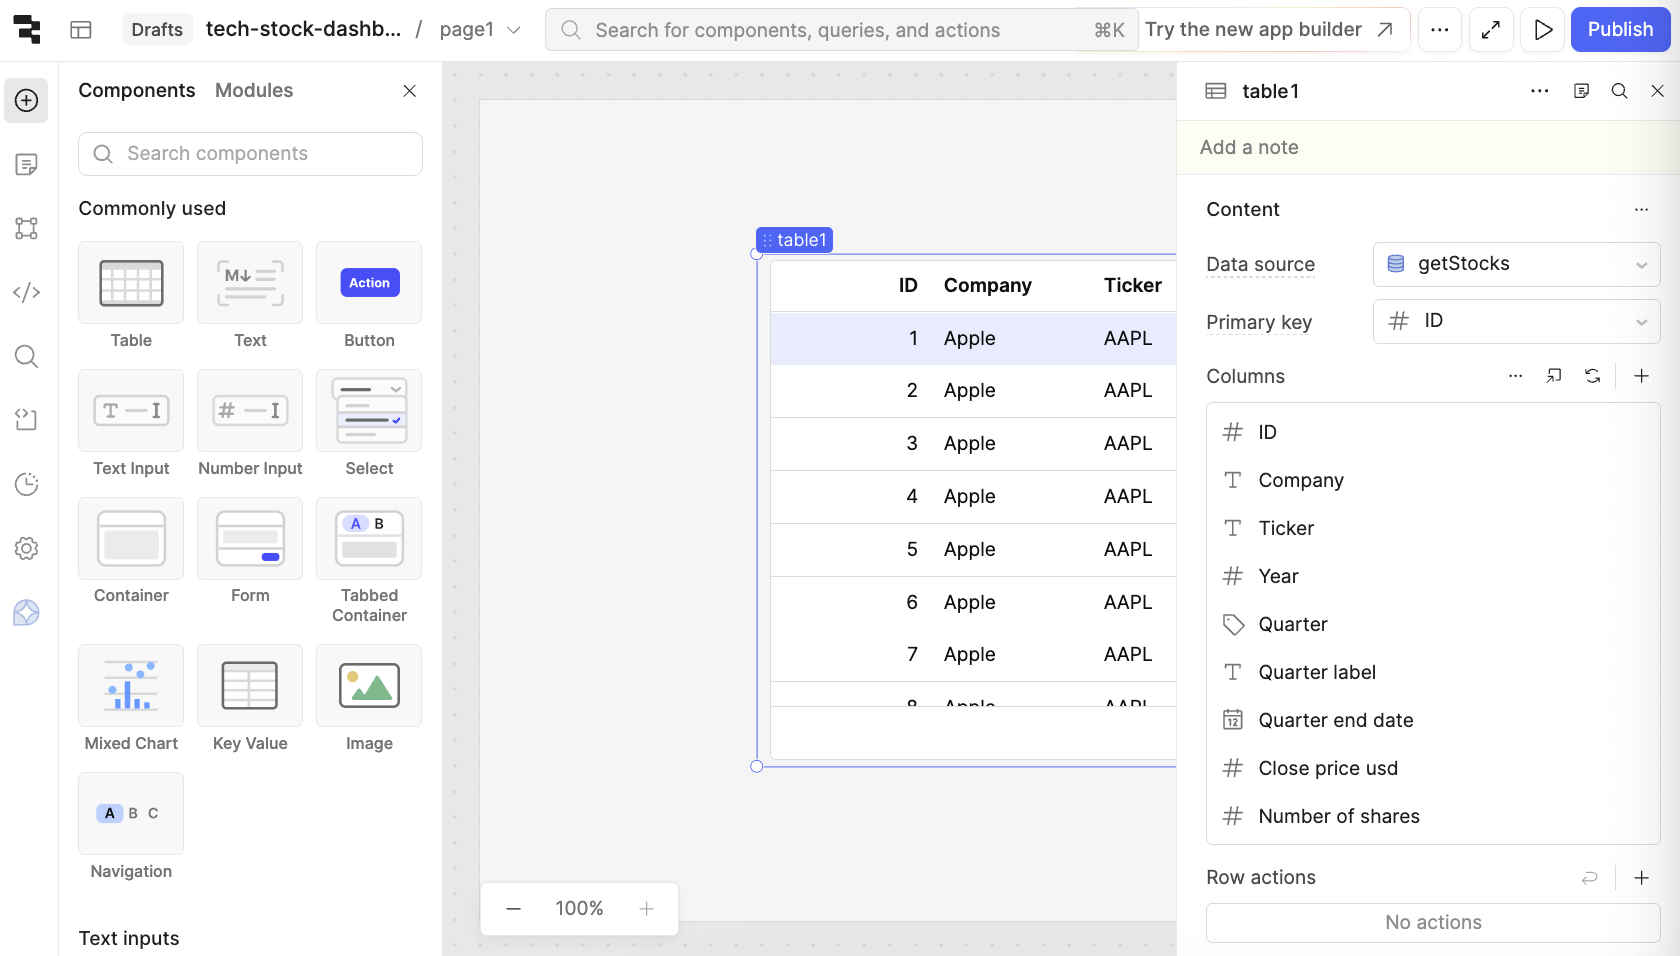
Next you will place a component to display the data in the application. A common component to employ is a Table.
- From the left panel, select Add UI > Table and drag and place onto the canvas.
- The table will attempt to use the
getStocksquery automatically populating the table. - Confirm that the table component
Contenthas a Data source set to getStocks. The following image shows this configuration.
Add an Interactive Chart
Next you will add a chart with a new query that is shaped for the chart inputs.
- Select Code > page1 > + > Resource query
- Query name =
chartData - Resource =
Retool Database - SQL:
select ticker,quarter_end_date,close_price_usd from data_builder_tech_stock_prices_quarterly - Query name =
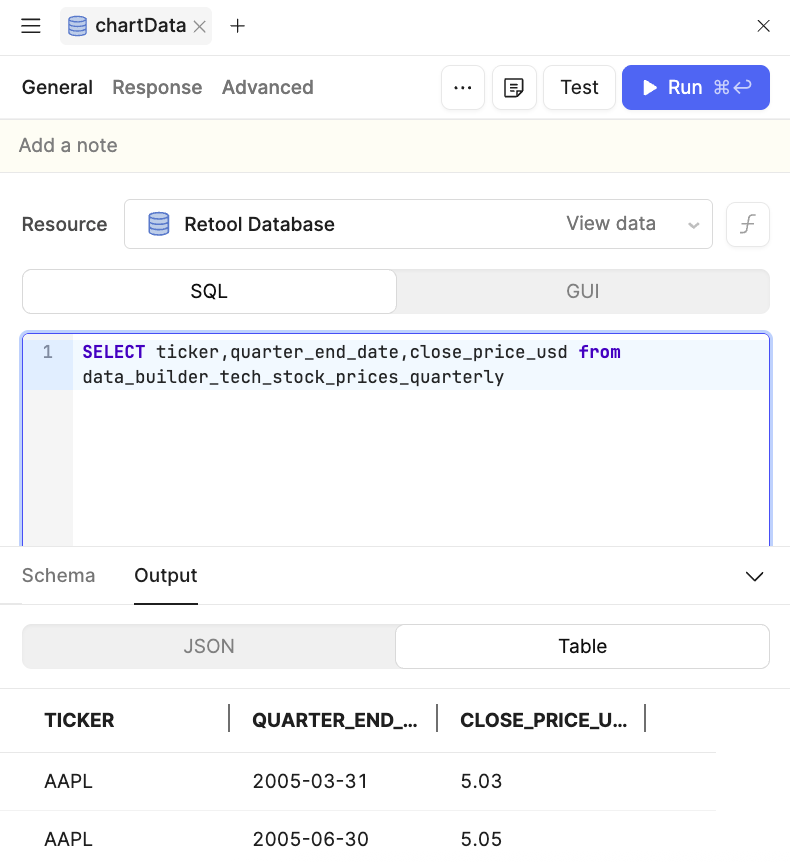
- Save & run the query to collect data to be used in the Chart definition phase.
- Next, from the left panel, select Add UI > Line chart and drag and place onto the canvas.
- Select the chart (e.g., lineChart1 ) and then Content > Series > (Series created)
- Configure the chart to use the Resource
chartData, X data forquarter_end_date, Y data forclose_price_usd, and Group byticker.
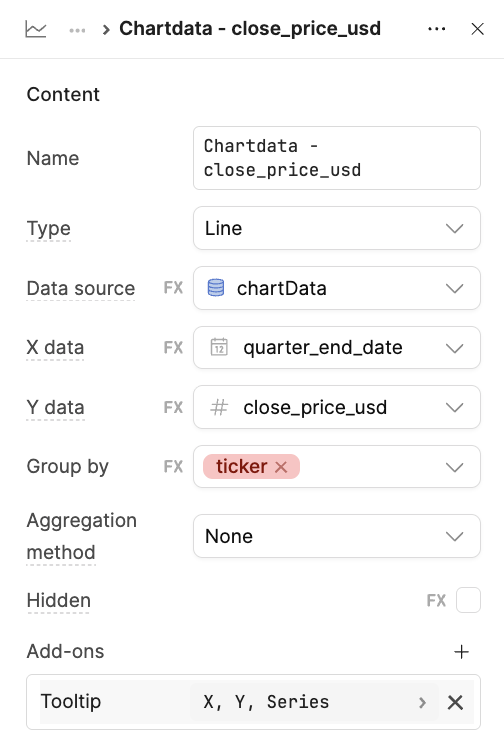
- Once updated the chart should then show the following data while hovering over it will display tooltip values:
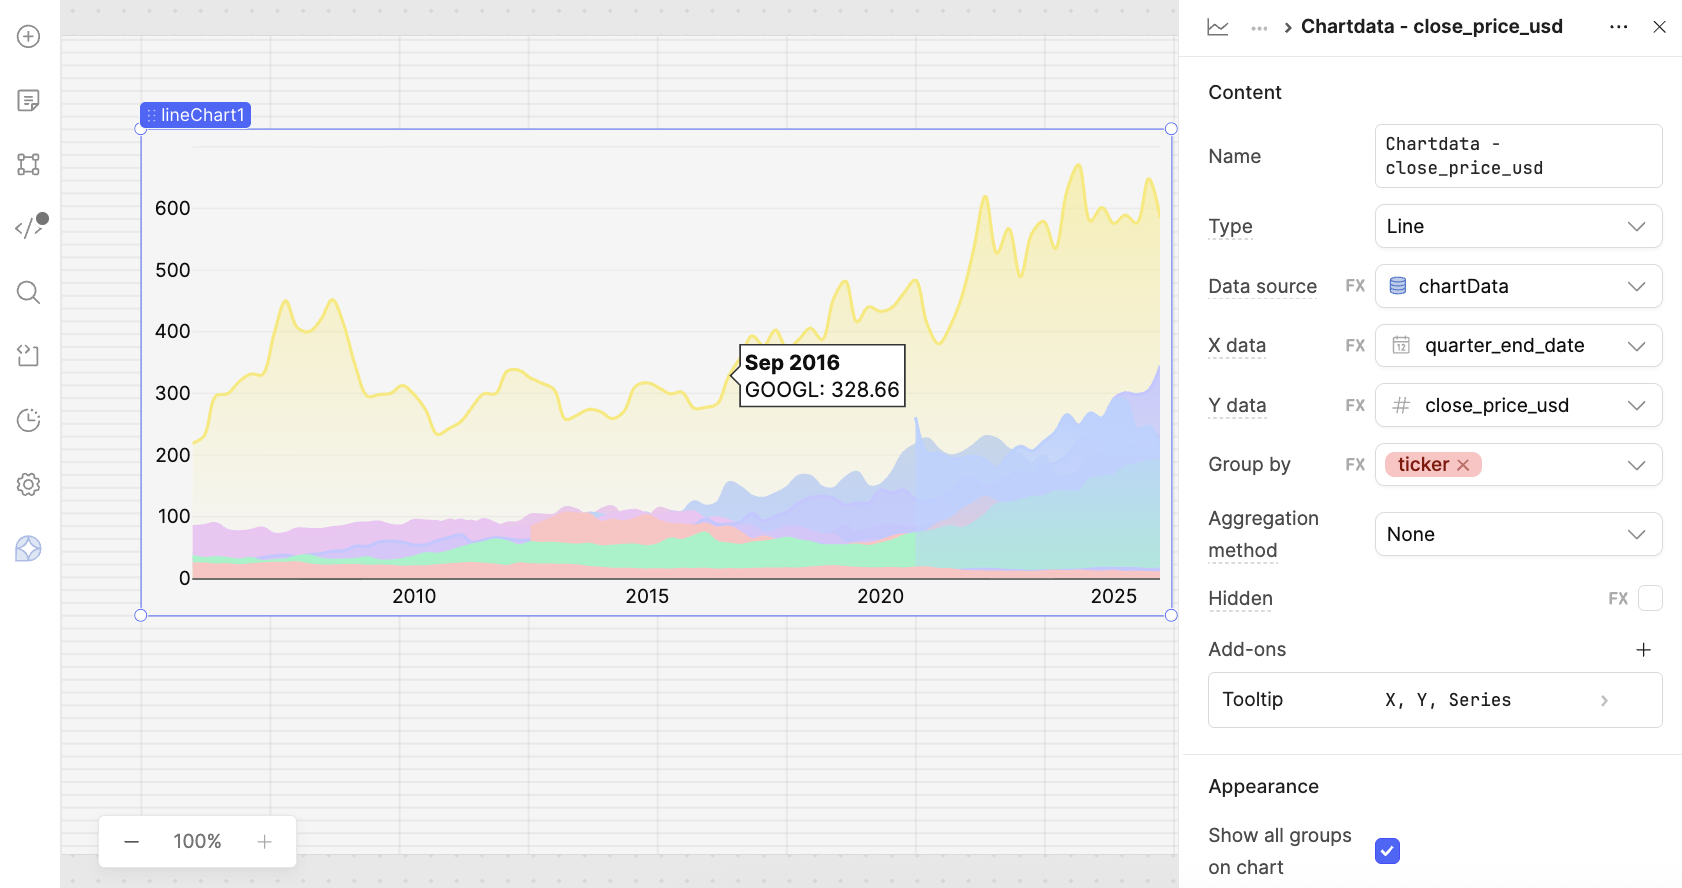
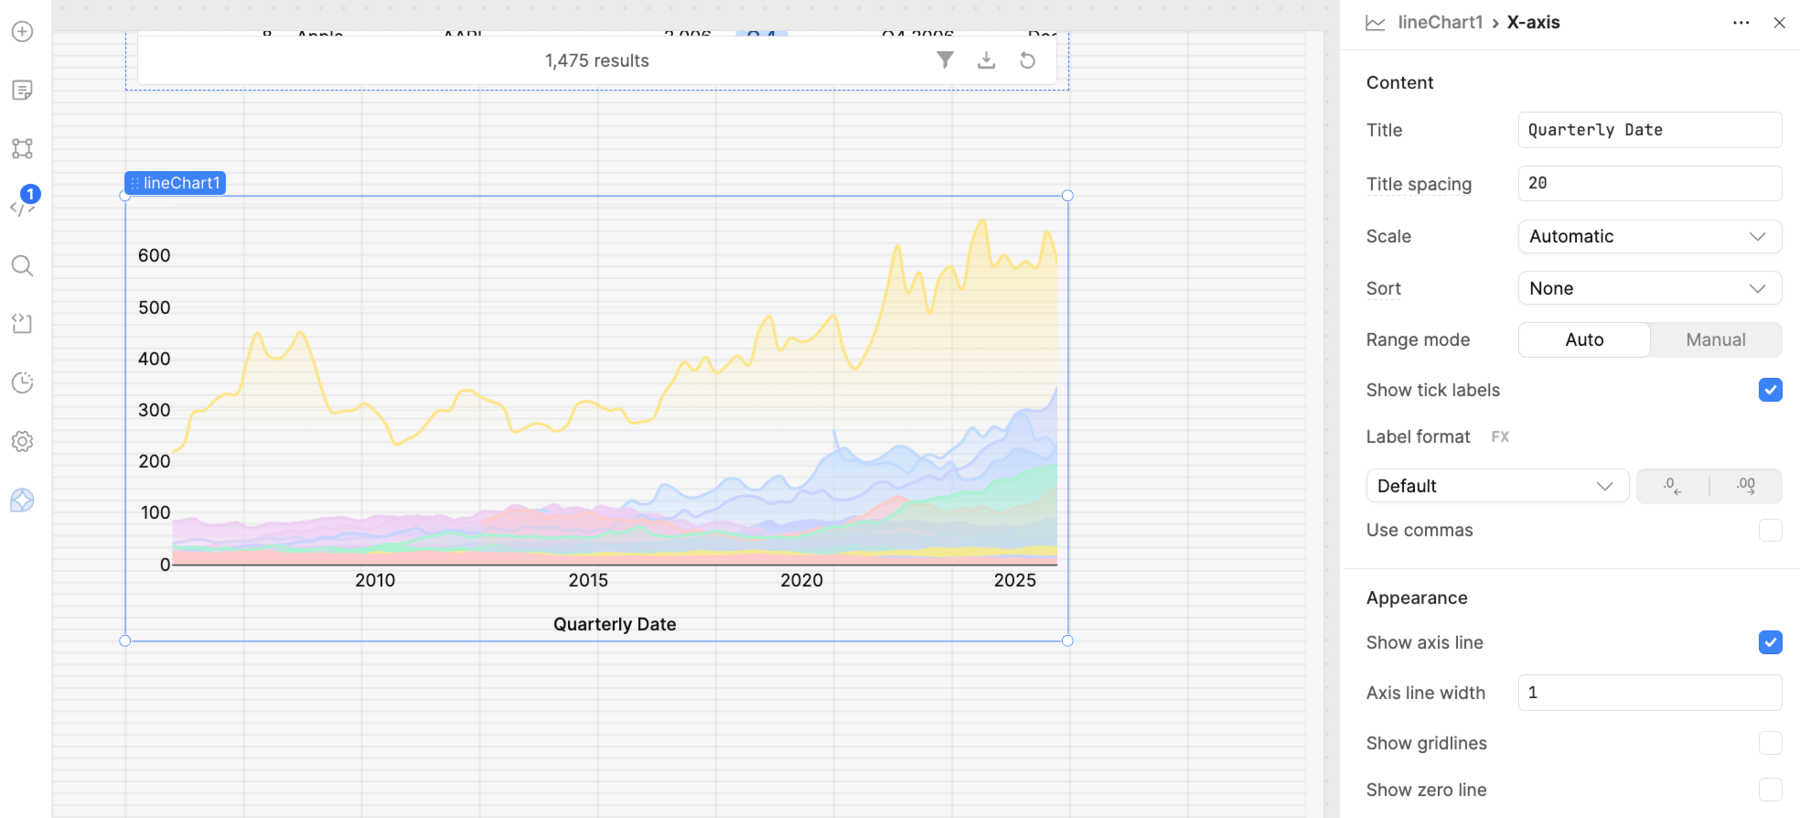
Next we can configure the axis with descriptions to make it easier for users to consume the chart data. You can start with the X-axis and specify it as Quarterly Date.
- Select lineChart1 > Axis controls > X-axis.
- Select Content > Title and put a value of
Quarterly Date
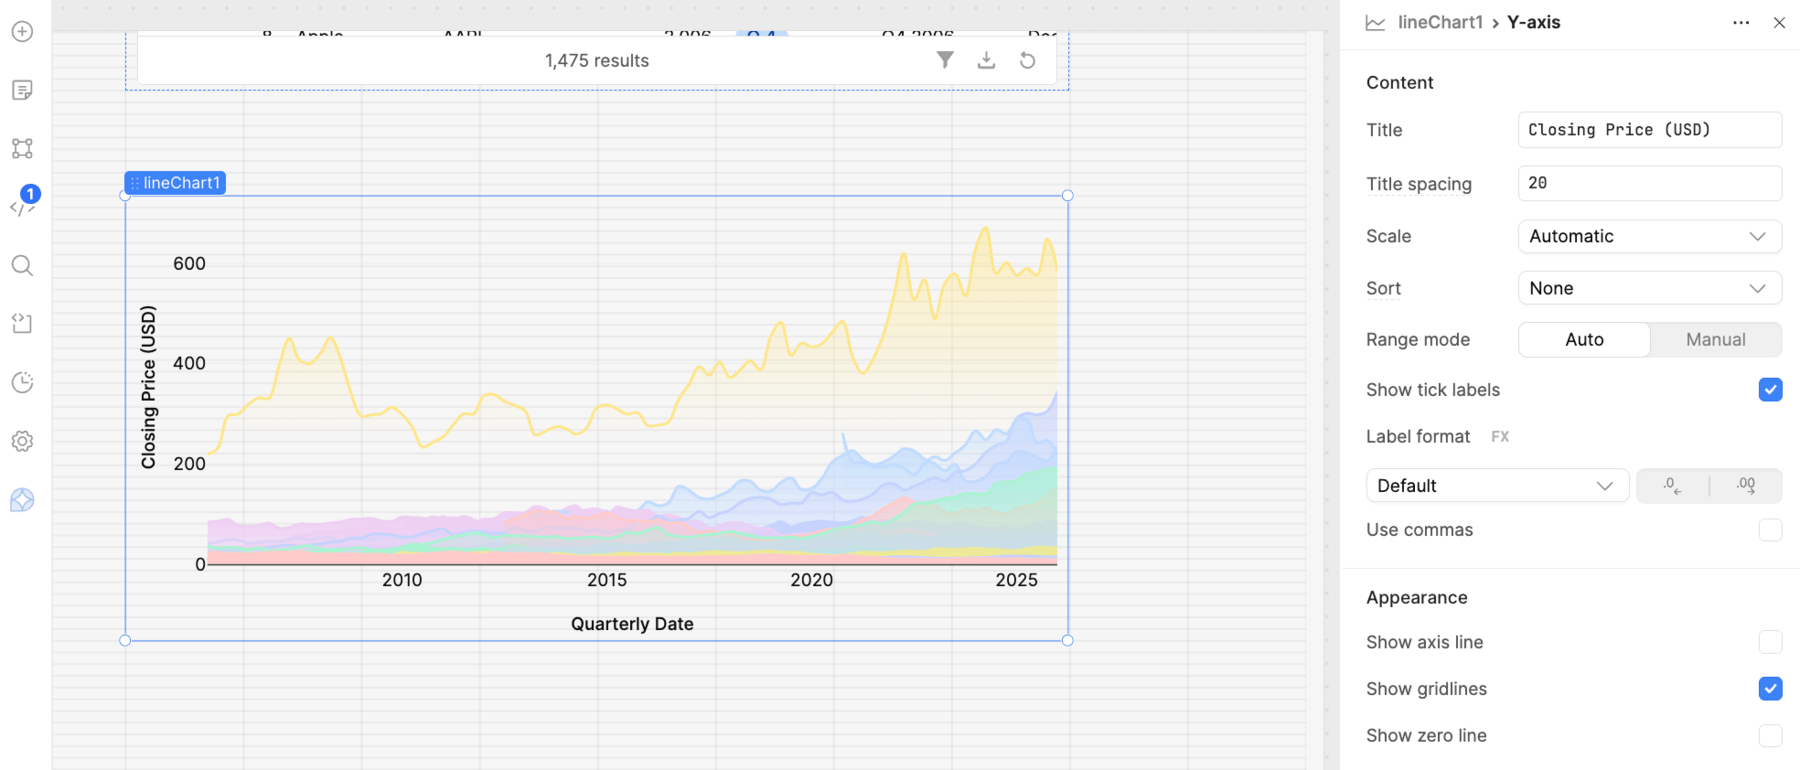
You can then update the Y-axis title.
- Select lineChart1 > Axis controls > Y-axis.
- Select Content > Title and put a value of
Closing Price (USD)
Summary
In this lab you learned how to create queries to populate a table and a line chart. In addition the chart configuration was modified to make it easier to understand the data.